Your long-term investment strategy is your North Star, helping you navigate through changing — and sometimes challenging — market conditions in order to achieve your financial goals. In this piece, we focus on the investment strategy implications of business ownership.
While a diversified investment portfolio is typically composed of traditional asset classes such as equities and fixed income, and in some cases, alternatives, as your wealth grows, you will likely have increasing opportunities to invest in non-traditional asset classes as well. This could include businesses, collectibles, precious metals and insurance policies, among many others.
Because it tends to fall outside standard investment portfolio asset allocation recommendations, your business ownership stake may be underrepresented in your long-term financial plan and the impact on your investment portfolio, overlooked. Consider treating business ownership like a traditional investment, as a business’s unique exposures can have a significant effect on your recommended asset allocation.
Know What You Own
The first step in understanding how business ownership impacts your investment portfolio is to classify the business by size (market capitalization) and style, sector and domicile, the same way you would with a traditional investment asset.
Using these characteristics, you and your advisor can identify a proxy asset to represent your business within the context of your investment portfolio.
Consider the example of an individual with approximately $32 million in investable assets, who also owns an industrial manufacturing business stake valued at just over $8 million. The business engages in the design, production and sale of lithium-ion battery cells for stationary energy storage, electric mobility and marine applications in Europe. The value of the investor’s total portfolio is $40 million, with the business representing 20% of overall assets.
Given the characteristics we know about the business, we can classify it as follows:
- Size: It is a small-cap business, given its market capitalization below $1 billion.
- Style: The business would be considered a “core” holding (that is, not classified as a “growth” or “value” style company).
- Sector: The business is in the Industrials sector.
- Domicile: Broadly speaking, the business operates in developed international economies, with most of the company’s revenue coming from Europe.
Depending on the nature of your private company, determining its key business characteristics can be a challenge. Thus, thorough analysis is needed so as not to select an inappropriate proxy and make misinformed portfolio management decisions.
Next, we use your business’s key characteristics to identify a similar publicly traded security. This proxy security allows business exposures to be incorporated within your broader investment portfolio and therefore provide a more accurate reflection of your full financial picture. If your business ownership represents a meaningful portion of your net worth but it is not considered in your investment portfolio strategy, you may have significantly skewed portfolio exposures.
Continuing with the example, we can review the portfolio exposure impacts of the business stake on size/style, sector and domicile using the proxy security.
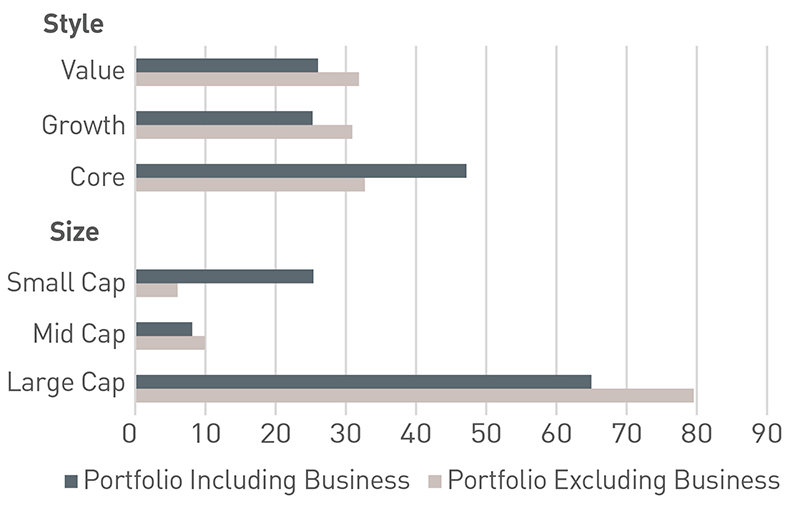
Size/Style (Figure 1): From the vantage point of “Portfolio Excluding Business,” the investor would appear to be significantly overweight to domestic equity and underweight to international equity. However, when considering the “Portfolio Including Business,” the portfolio composition changes; it would have a meaningful overweight to developed international small-cap core. Constructing an investment portfolio that includes the investor’s entire financial portfolio (represented by Portfolio Including Business) would likely entail increasing exposures to developed international large cap and emerging markets — a materially different recommendation than if the business stake was not considered.
Source: FactSet®. FactSet® is a registered trademark of FactSet Research Systems Inc. and its affiliates.
View Figure 1 accessible version
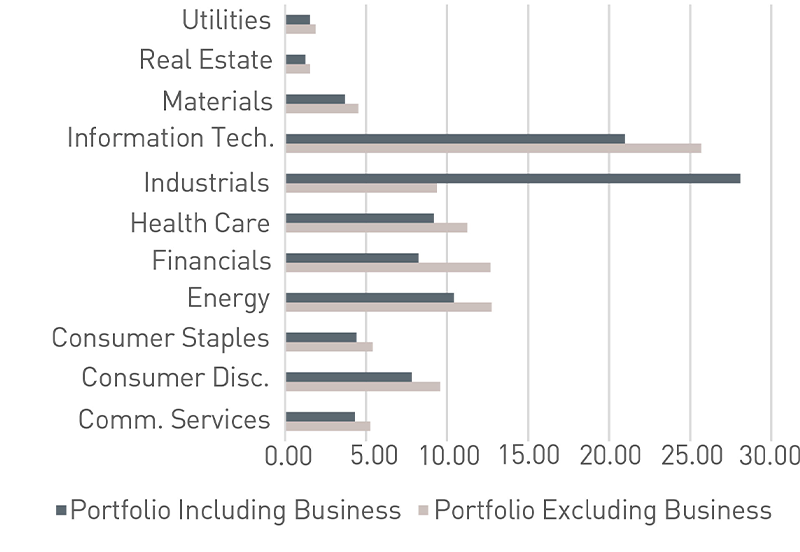
Sector/Industry (Figure 2): Again, when only considering the “Portfolio Excluding Business,” it appears the portfolio is underweight Industrials and overweight Technology and Energy. However, by incorporating the business stake, the portfolio’s exposure to Industrials jumps from balanced to a meaningful overweight. Thus, constructing a portfolio that includes the business stake would entail avoiding additional exposures to Industrials, Energy and Technology.
Source: FactSet®
View Figure 2 accessible version
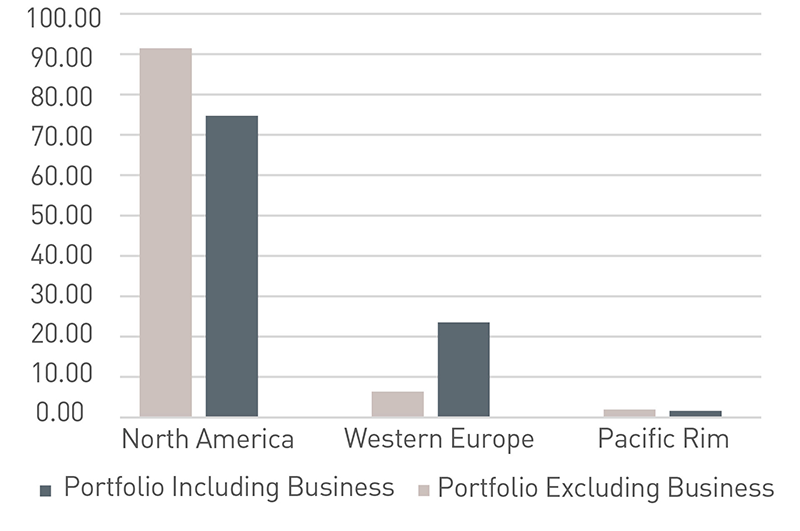
Domicile (Figure 3): Incorporating the geographic exposure from the business stake significantly reduces an overweight to North America and reverses Western Europe from an underweight to an overweight. The “Portfolio Including Business” helps avoid reducing exposures to North America and adding to Western Europe.
Source: FactSet®
View Figure 3 accessible version
The Bottom Line for Business Owners
As a business owner, considering your business as a part of your asset allocation could help avoid unintended investment exposures by considering your full financial picture. The alternative could not only derail your long-term return expectations, but it could also lead to unbalanced risk exposures and ultimately jeopardize your investment goals and objectives.
To learn more about how your business ownership impacts your portfolio, please contact your advisor.
TEXT VERSION OF CHARTS
Figure 1 (view image)
Portfolio Excluding Business |
Portfolio Including Business
|
|
Equities |
97.33 |
99.93 |
Domestic Equity |
85.88 |
70.13 |
Large Cap |
71.41 |
58.32 |
Core |
22.35 |
18.25 |
Growth |
25.08 |
20.48 |
Value |
23.98 |
19.59 |
Mid Cap |
9.93 |
8.11 |
Core |
4.67 |
3.81 |
Growth |
3.58 |
2.93 |
Value |
1.68 |
1.37 |
Small Cap |
4.50 |
3.67 |
Core |
2.05 |
1.68 |
Growth |
1.03 |
0.84 |
Value |
1.42 |
1.16 |
Equity - Other |
0.06 |
0.05 |
International Equity |
10.66 |
29.16 |
Developed Large Cap |
8.15 |
6.66 |
Core |
3.09 |
2.52 |
Growth |
0.98 |
0.80 |
Value |
4.09 |
3.34 |
Developed Small Cap |
1.54 |
21.71 |
Core |
0.56 |
20.91 |
Growth |
0.26 |
0.22 |
Value |
0.71 |
0.58 |
Emerging Markets |
0.96 |
0.78 |
Mid Cap |
0.00 |
0.00 |
Small Cap |
0.01 |
0.01 |
Figure 2 (view image)
Portfolio Excluding Business |
Portfolio Including Business |
|
Communication Services |
5.26 |
4.30 |
Consumer Discretionary |
9.57 |
7.81 |
Consumer Staples |
5.41 |
4.42 |
Energy |
12.75 |
10.42 |
Financials |
12.67 |
8.23 |
Health Care |
11.25 |
9.18 |
Industrials |
9.37 |
28.10 |
Information Technology |
25.69 |
20.98 |
Materials |
4.53 |
3.70 |
Real Estate |
1.55 |
1.26 |
Utilities |
1.88 |
1.54 |
Figure 3 (view image)
Portfolio Excluding Business |
Portfolio Including Business |
|
North America |
91.46 |
74.70 |
Western Europe |
6.35 |
23.53 |
Pacific Rim |
1.92 |
1.57 |
Central Asia |
0.10 |
0.08 |
Middle East |
0.08 |
0.06 |
South America |
0.04 |
0.04 |
Africa |
0.02 |
0.02 |
Eastern Europe |
0.01 |
0.01 |


