
De un año a otro, las donaciones filantrópicas son moldeadas por una variedad de influencias, que incluyen cambios económicos, cambios impositivos y de política y movimientos sociales, por nombrar algunas. Comprender el panorama actual de las donaciones puede ayudar a las organizaciones sin fines de lucro a informar sus estrategias de recaudación de fondos, lo que les permite tener una mejor preparación en términos financieros tanto a corto como a largo plazo.
Tendencias principales
Las donaciones totales han disminuido
En 2023, las donaciones totales alcanzaron los $557,160 millones, lo que representó una disminución del 2.1 % (ajustada según la inflación) respecto de 2022, y el total de donaciones de 2022 tuvo una disminución del 10.5 % respecto de 2021.
Un menor número de donadores, donaciones de monto más elevado
En 2023, las donaciones a entidades benéficas realizadas por personas provenían de una menor cantidad de fuentes. Las mega donaciones de los donantes de patrimonio neto ultraalto continuaron aumentando ($2,240 millones en 2023, en comparación con $1,080 millones en 2022), aunque el número total de donantes disminuyó.
Cambio en los instrumentos de donación
Las donaciones mediante fondos designados por los donantes (Donor-advised funds, DAF) alcanzaron un máximo histórico en 2022. Las distribuciones benéficas calificadas (QCD) y los fideicomisos benéficos de bienes remanentes (CRT) también adquirieron popularidad a medida que los donantes aprovechaban las oportunidades de beneficios fiscales.
¿Quiénes están haciendo donaciones?
En 2023, la mayoría de las donaciones benéficas fueron realizadas por personas y fundaciones (Figura 1).
Gráfico 1. Fuente de contribuciones de 2024
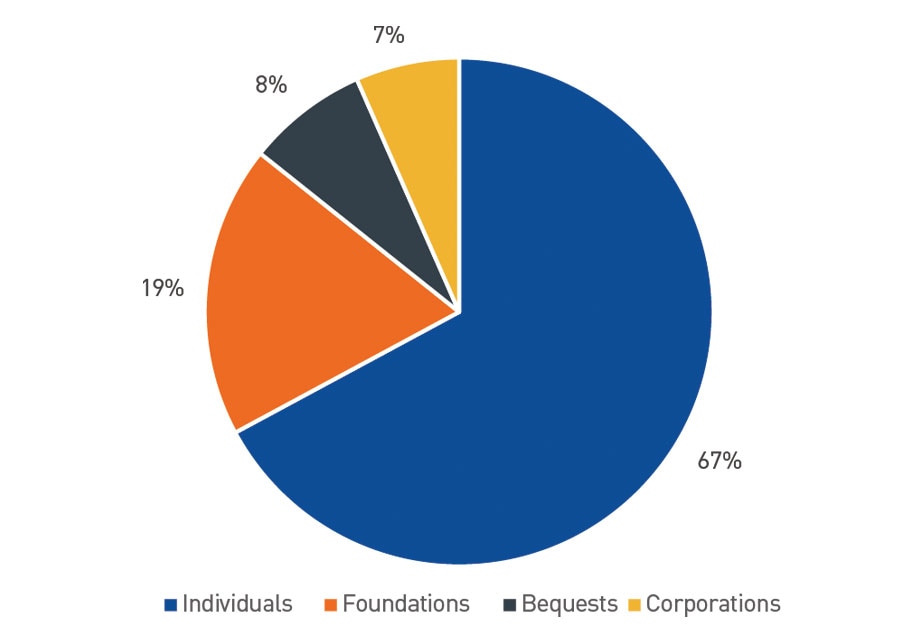
Fuente: Giving USA 2024
Después de 2022, cuando los mercados experimentaron descensos que se observaron por última vez durante la Gran crisis financiera, el índice S&P 500® regresó al nivel de 24.2 % en 2023. Las preocupaciones económicas y geopolíticas que impulsaron la agitación del mercado en 2022 continuaron en gran medida en 2023. Aunque los rendimientos mejoraron, la incertidumbre económica y la volatilidad del mercado generaron obstáculos para la filantropía.
Las donaciones de fundaciones tuvieron un aumento del 1.7 %, lo que supone una disminución del 2.3 % cuando se ajusta según la inflación respecto del año anterior. Debido a que las donaciones de fundaciones a menudo se ven afectadas por el rendimiento que el mercado tuvo el año anterior, la disminución no es tan sorprendente considerando el impacto negativo de los rendimientos de 2022. Las fundaciones se encuentran en una buena posición para aumentar las donaciones en 2024 y 2025, debido al sólido rendimiento que el mercado tuvo en 2023. Los activos de las fundaciones alcanzaron un máximo histórico de $1.5 billones y presentaron un crecimiento a razón de una tasa anualizada promedio del 8.3 %.
Si bien las donaciones corporativas descendieron un 1.1 % sobre una base ajustada según la inflación en 2023, en dólares actuales, las donaciones corporativas tuvieron un incremento del 3.0 % debido al aumento de las ganancias corporativas antes de impuestos y al sólido crecimiento del PIB estadounidense.
¿Quiénes están recibiendo las donaciones?
De un año a otro, se presentan cambios en las donaciones a diferentes categorías de causas. Comprender dichos cambios puede ayudar a las organizaciones a tener una idea de la opinión que los donantes tienen en relación con el ámbito de su causa. En años recientes, los eventos como la pandemia mundial de COVID-19, la disrupción geopolítica y los efectos que la inflación tiene en la comunidad han influido en las causas a las que se han destinado las donaciones benéficas. En 2023, las organizaciones de orientación religiosa continuaron recibiendo la proporción más grande de las contribuciones totales, seguido de las organizaciones de servicios humanos y relacionadas con la educación (Figura 2).
Figura 2. Proporción de contribuciones de 2024
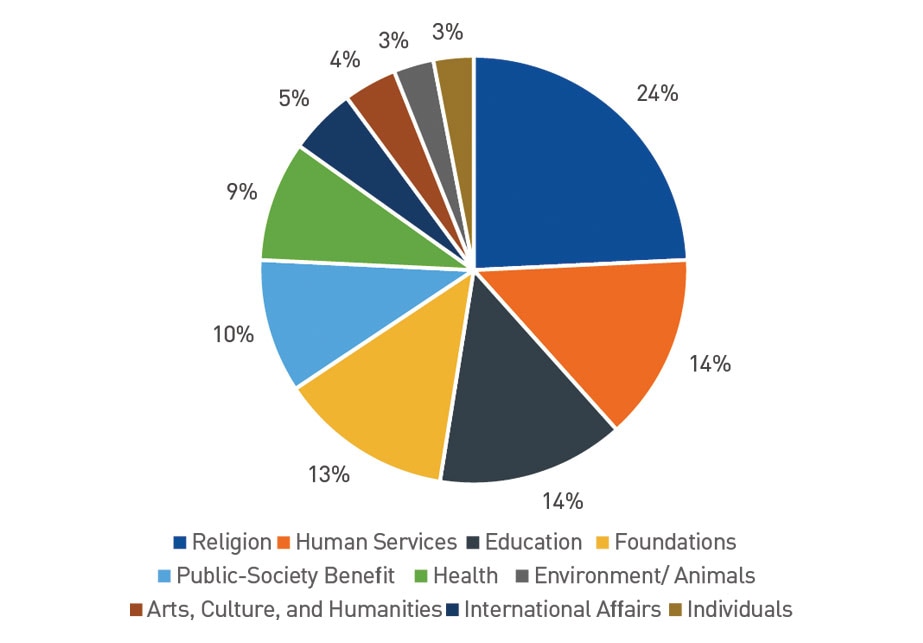
Fuente: Giving USA 2024
De 2022 a 2023, los principales cambios incluyeron las donaciones a personas, que tuvieron una disminución del 17.2 % en 2023, y las donaciones a las artes, la cultura y las humanidades, el beneficio público de la sociedad y la educación, todos los cuales tuvieron incrementos del 11 % o más.
¿Cómo influyeron los indicadores económicos en las donaciones a entidades benéficas?
Los factores económicos afectan las donaciones a entidades benéficas, en particular a las realizadas por personas. Una economía favorable es un entorno filantrópico favorable. Aunque el PIB y el crecimiento del mercado de valores crearon un entorno de donaciones beneficioso en 2023, este siguió a un mercado agitado en 2022 y se ha presentado en un entorno macroeconómico caracterizado por inflación superior al promedio y tasas de interés elevadas. En 2022, la inflación estadounidense alcanzó su nivel máximo en 40 años al ubicarse en 9.1 %, lo que provocó 11 subidas de tasas de parte de la Reserva Federal entre marzo de 2022 y julio de 2023.
Estos factores generaron una incertidumbre financiera para las personas y las familias, lo que dio lugar a la disminución de las donaciones realizadas por personas como porcentaje de los ingresos disponibles y como porcentaje del PIB (Figura 3).
Figura 3: Donaciones de personas a beneficiarios de distribuciones de programas de inversión
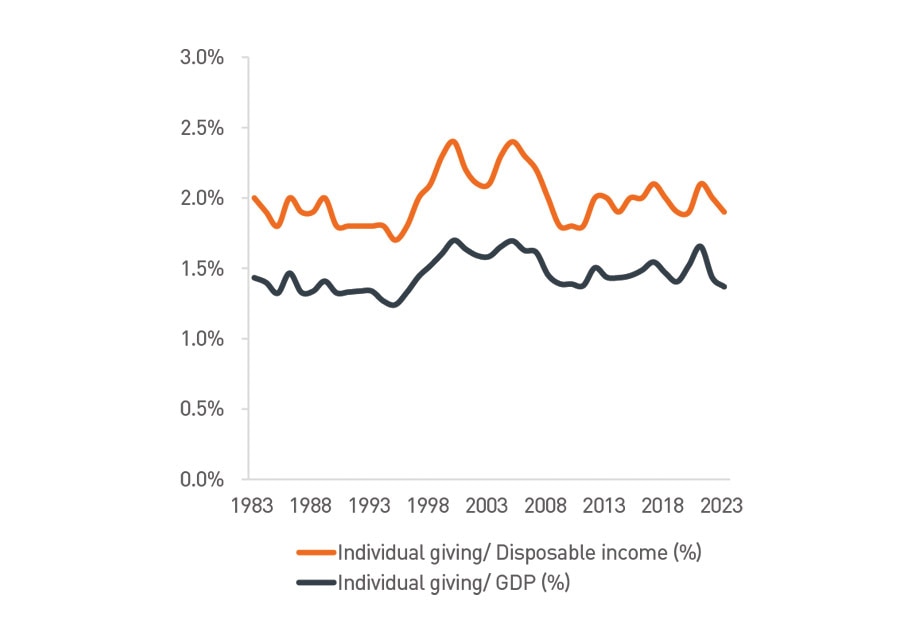
Fuente: Giving USA 2024
Cómo hacen donaciones los donantes
Si bien los factores económicos y sociales afectan la filantropía, las organizaciones sin fines de lucro pueden tomar medidas para reforzar las prácticas de recaudación de fondos. Las organizaciones sin fines de lucro podrían considerar las maneras en que los donantes prefieren hacer donaciones e incorporar las estrategias desaprovechadas en los esfuerzos de educación de los donantes.
Por ejemplo, existe un estimado de $72 billones en activos cuya transferencia intergeneracional está prevista para los próximos 25 años, y la mayor parte de esa riqueza se mantiene en activos que no son dinero en efectivo, como títulos, bienes raíces, arte y otros activos tangibles. Las organizaciones sin fines de lucro deben estar al tanto de los instrumentos de donación más populares, así como de los que están adquiriendo una mayor popularidad, a fin de establecer los procesos y las políticas que facilitan que los donantes hagan donaciones. Este es un buen momento para que las organizaciones sin fines de lucro revisen su política de aceptación de donaciones, así como la redacción del contenido de su página de donaciones, a fin de aclarar cuáles son las estrategias de donación pueden admitir.
Los fondos designados por los donantes alcanzan su máximo nivel histórico
Las contribuciones a los DAF alcanzaron su máximo nivel histórico en 2022, con un incremento del 9 % entre el año fiscal 2021 y el año fiscal 2022. De manera similar, las distribuciones de los DAF ascendieron a un total de $52,160 millones en 2022, lo que supone un incremento interanual del 9.1 %.
Aumenta la popularidad de las distribuciones benéficas calificadas
La Ley SECURE Act 2.0 promulgada en diciembre de 2022 incluyó la Ley de IRA Heredada (Legacy IRA Act), que amplió las distribuciones benéficas calificadas para incluir el financiamiento de fideicomisos benéficos de bienes remanentes (CRT) y anualidades de donaciones a entidades benéficas de participación dividida, lo que en última instancia aumenta las oportunidades que los donantes tienen para hacer donaciones. La popularidad de ambos tipos de QCD ha aumentado, lo que se debe principalmente a la mayor conciencia a través de los esfuerzos de marketing y educación.
Las QCD pueden permitir que las personas reduzcan sus ingresos gravables en los años en los que deben realizar distribuciones requeridas de sus cuentas IRA, lo que brinda una manera con ventajas fiscales para hacer donaciones. A las organizaciones sin fines de lucro les conviene preguntarles a sus donantes elegibles sobre la experiencia que tienen con las QCD, así como considerar solicitar dichas donaciones, en particular al acercarse el fin de año, cuando las personas deben cumplir las fechas límite de las distribuciones mínimas requeridas.
¿Cuál fue el impacto que la política del gobierno tuvo en las donaciones realizadas por los donantes?
Los factores como la política del gobierno y la intervención regulatoria, incluido el estímulo monetario y fiscal, pueden afectar el momento, y en qué medida, los donantes deciden hacer donaciones. Aunque la motivación principal que la mayoría de los donantes tienen para hacer contribuciones a las organizaciones sin fines de lucro no es la obtención de una ganancia financiera, las organizaciones sin fines de lucro históricamente se han beneficiado del aumento de las donaciones cuando los donantes tienen el incentivo de donar, por ejemplo, mediante la política fiscal.
Al recibir una deducción de impuestos por las donaciones benéficas, los donantes a menudo pueden reducir sus ingresos brutos ajustados (AGI) y evitar pagar el impuesto sobre ganancias de capital al hacer donaciones de títulos revalorizados. En 2020, la introducción de la Ley CARES proporcionó un ejemplo de este tipo de política fiscal incentivadora. La Ley se amplió en 2021 y permitió que los contribuyentes con declaraciones detalladas reciban una deducción de hasta el 100 % de los AGI por las contribuciones en efectivo (previo a la Ley CARES la deducción era del 60 %). Los contribuyentes sin declaraciones detalladas que aplican la deducción de impuestos estándar podrían deducir hasta $300 si presentan una declaración individual, y hasta $600 en el caso de las personas casadas que presentan una declaración conjunta. Sin embargo, estas disposiciones vencen en 2022, dando lugar a nuevas propuestas para modificar el código fiscal a fin de incentivar las donaciones a entidades benéficas de una forma más permanente.
En febrero de 2023, se introdujo la Ley de Iniciativas Benéficas (Charitable Act) en el Senado para establecer una deducción benéfica universal. La propuesta de ley, que cuenta con apoyo bipartidista, restablecería la autorización para que los contribuyentes sin declaraciones detalladas deduzcan las donaciones benéficas de sus ingresos brutos ajustados.
El vencimiento de las disposiciones del código fiscal establecidas en la Ley de Empleo y Reducción de Impuestos (TCJA) de 2017 está previsto para finales de 2025, y las entidades benéficas y los donantes por igual están monitoreando si dichas disposiciones serán renovadas o sustituidas. Una de las disposiciones incluye el límite de deducción benéfica. Tras el vencimiento de la TCJA, el monto de la deducción benéfica se reduciría del 60 % de los ingresos brutos ajustados para las donaciones en efectivo, al monto anterior del 50 %.
Los directivos de las organizaciones sin fines de lucro deben estar al tanto de los demás impactos legislativos y regulatorios potenciales, tales como las reglas de los fondos designados por los donantes propuestas por el IRS, la Ley “SEAT” y otros. Aparte del asesoramiento legal de los asesores fiscales, las asociaciones sin fines de lucro estatales pueden ser un excelente recurso para ayudar a mantenerse informados de los cambios regulatorios y el impacto que estos tienen en las organizaciones sin fines de lucro.
Conclusión
En nuestra opinión, hay varios indicadores positivos con respecto a las donaciones a entidades benéficas en los próximos años, en particular a medida que la inflación elevada comienza a disminuir y el rendimiento del mercado de inversiones continúa generando rendimientos positivos. Las organizaciones sin fines de lucro pueden recurrir a los socios de su red, incluido su asesor de inversiones, a fin de conocer los obstáculos y los impulsos que enfrenta la filantropía.
VERSIÓN DE TEXTUAL DE LOS GRÁFICOS
Gráfico 1. Fuente de las contribuciones (ver imagen)
individuos |
67 % |
Fundaciones |
19 % |
Legados |
8% |
Corporaciones |
7% |
Fuente: Giving USA 2024
Figura 2: Proporción de las contribuciones (ver imagen)
Religión |
24 % |
Servicios humanos |
14% |
Educación |
14% |
Fundaciones |
13% |
Beneficio público de la sociedad |
10 % |
Salud |
9% |
Asuntos internacionales |
5 % |
Arte, cultura y humanidades |
4 % |
Medio ambiente/animales |
3 % |
individuos |
3 % |
Figura 3: Donaciones de personas como porcentaje de los ingresos disponibles (ver imagen)
Año |
Donaciones de personas (en dólares actuales) |
Donaciones de personas/ingresos disponibles (%) |
PIB (en dólares actuales) |
Donaciones de personas/PIB (%) |
1983 |
$52.06 |
2.0% |
$3,634 |
1.43 % |
1988 |
$69.98 |
1.9 % |
$5,236 |
1.34 % |
1993 |
$91.72 |
1.8% |
$6,859 |
1.34 % |
1998 |
$137.68 |
2.1% |
$9,063 |
1.52% |
2003 |
$181.47 |
2.1% |
$11,458 |
1.58 % |
2008 |
$213.76 |
2.0% |
$14,713 |
1.45 % |
2013 |
$242.43 |
2.0% |
$16,881 |
1.44 % |
2018 |
$302.80 |
2.0% |
$20,657 |
1.47 % |
2023 |
$374.40 |
1.9 % |
$27,361 |
1.37 % |
Fuente: Giving USA 2024