
Summary of study results
After posting an average return of -8.0% in FY22, surveyed endowments reported an average return of 7.7% in FY23. These positive returns led to an average increase of 2.7% in total endowment values after netting out spending.
- Smaller endowments benefited from greater exposure to publicly traded equities. Strong public equity market returns in FY23, combined with the higher allocation to public equities that smaller endowments reported having (endowments with assets under $50 million had an approximate 60% allocation to public equities, whereas those with assets between $251-500 million had an approximate 45% allocation), left such organizations better positioned to benefit from the performance turnaround. Endowments with over $1 billion in assets, which had public equity allocations from 23% to 36%, experienced a lag in returns.
- While 1-year returns for larger endowments were negatively impacted by greater exposure to alternative investment, alternatives exposure benefited such portfolio alternatives over the long term. Endowments with more than $5 billion in assets allocated 32% of their portfolios to private equity (17%) and venture capital (15%) in FY23, approximately 10 times the allocation of endowments under $50 million (2.9%). For the largest endowments (those with over $5 billion in assets), venture capital posted returns of -9.5% and private equity returned 3.1%.
While endowments under $50 million outperformed endowments over $5 billion by 700 basis points, larger endowments still outperformed over the long term.
Three key takeaways
For higher education leaders and trustees, we highlight three key questions that this study can help answer.
- As higher education institutions nationwide adjust to post-pandemic fundraising realities, how are new gifts contributing to endowment growth?
Fundraising retains importance for endowment growth.
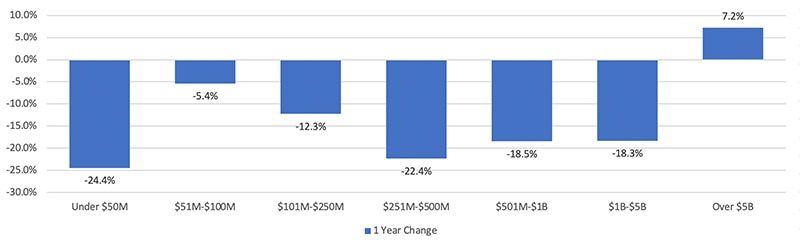
Endowments rely on two primary avenues for growth: investment returns and new gifts. After a banner year for giving in FY22, endowments across nearly all size categories reported declines in new gifts in FY23, with pronounced drops among endowments under $50 million (-24%) and from $251-$500 million (-22%). Total new gifts to endowments came in at $13.3 billion, compared to $14.9 billion last year.
| Questions for discussion: |
|
|
2. How did asset allocation impact endowment performance, and what are some of the primary considerations for endowments considering making a change?
Alternatives continue to boost long-term returns for larger endowments
Asset allocation is widely recognized as the primary driver of investment returns. Larger endowments had greater allocations to alternative strategies, resulting in relative underperformance this year, with a 2.8% average return for endowments over $5 billion compared to 9.8% for endowments under $50 million. However, median 10-year returns for endowments above $5 billion were 9.4%, compared to a median of 6.4% for endowments under $50 million.
Figure 2: Endowment Asset Allocation, FY23
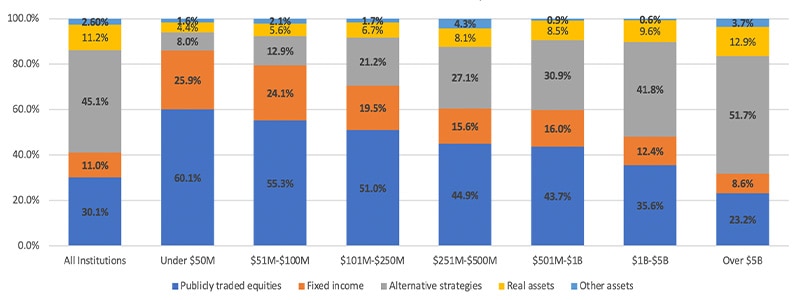
Source: NACUBO
View accessible version of this chart.
| Questions for discussion: |
|
|
| Questions for discussion: |
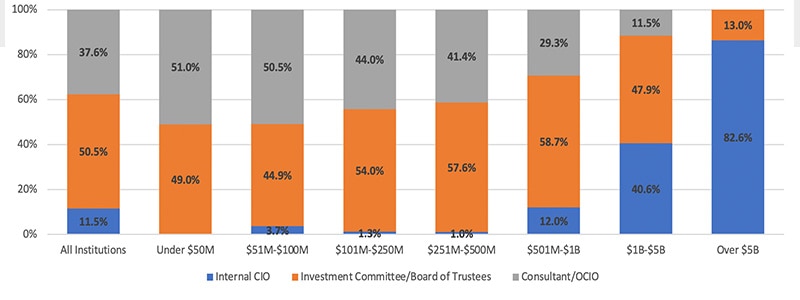
| Most institutions are leveraging some form of external and/or board support to develop asset allocation guidelines. What is your current process for developing your asset allocation and selecting managers? |
| How does your current investment policy statement assign responsibility for the different aspects of governance to the committee and your OCIO/consultant? |
Let's Talk
Accessible Version of Charts
| Under $50M | $51M-$100M | $101M-$250M | $251M-$500M | $501M-$1B | $1B-$5B | Over $5B | ||
| FY23 | 140,303 | 308,390 | 754,562 | 839,518 | 1,294,916 | 5,193,325 | 4,817,623 | 13,348,637 |
| FY22 | 185,693 | 325,886 | 859,947 | 1,081,313 | 1,588,043 | 6,357,795 | 4,493,315 | 14,891,992 |
| 1 Year Change | -24.4% | -5.4% | -12.3% | -22.4% | -18.5% | -18.3% | 7.2% | -10.4% |
| All Institutions | Under $50M | $51M-$100M | $101M-$250M | $251M-$500M | $501M-$1B | $1B-$5B | Over $5B | |
| Publicly traded equities | 30.1% | 60.1% | 55.3% | 51.0% | 44.9% | 43.7% | 35.6% | 23.2% |
| Fixed income | 11.0% | 25.9% | 24.1% | 19.5% | 15.6% | 16.0% | 12.4% | 8.6% |
| Alternative strategies | 45.1% | 8.0% | 12.9% | 21.2% | 27.1% | 30.9% | 41.8% | 51.7% |
| Real assets | 11.2% | 4.4% | 5.6% | 6.7% | 8.1% | 8.5% | 9.6% | 12.9% |
| Other assets | 2.60% | 1.6% | 2.1% | 1.7% | 4.3% | 0.9% | 0.6% | 3.7% |
| Total | 100.00% | 100.00% | 100.00% | 100.10% | 100.00% | 100.00% | 100.00% | 100.10% |
Chart 3: Primary Responsibility for Day-to-Day Management: Asset Allocation, FY
| All Institutions | Under $50M | $51M-$100M | $101M-$250M | $251M-$500M | $501M-$1B | $1B-$5B | Over $5B | |
| Internal CIO | 11.5% | 0.0% | 3.7% | 1.3% | 1.0% | 12.0% | 40.6% | 82.6% |
| Investment Committee/Board of Trustees | 50.5% | 49.0% | 44.9% | 54.0% | 57.6% | 58.7% | 47.9% | 13.0% |
| Consultant/OCIO | 37.6% | 51.0% | 50.5% | 44.0% | 41.4% | 29.3% | 11.5% | 0.0% |