Summary of study results
Study participants reported average investment returns of 11.2% for fiscal year (FY) 2024, an increase from the 7.7% reported in FY23. These strong returns, in combination with a rise in gift giving, increased the average total market value for endowments by 6.7%, four percentage points higher than the increase seen in FY 2023.
Public equities generated the highest return for the second year straight.
As in 2023, investors with an overweight to public equity, typically smaller endowments, experienced higher returns relative to other asset allocations. Fixed income and alternatives continued to underperform compared to the public equity market. While high interest rates negatively impacted the private equity market, rate cycle easing served as a tailwind for the fixed income market, allowing for modest gains.
The average reported return of 11.2% served as the second-highest return over the last five years.
Overall, FY24 was characterized by a strong U.S. economy based on steady consumer spending, strong employment data, easing inflation accompanied by the prospect of lower interest rates, reasonable energy costs and a prosperous technology sector headlined by artificial intelligence.
Key takeaways from study participant’s top concerns
This year’s survey asked participants to identify their top two concerns. Their responses highlighted what is top of mind for higher education institutions and formed the basis of our annual key takeaways, constructed to provide insight and outline considerations for higher education leaders and trustees.
1. Higher education leaders are looking for ways to mitigate risk and effectively measure endowment portfolio performance.
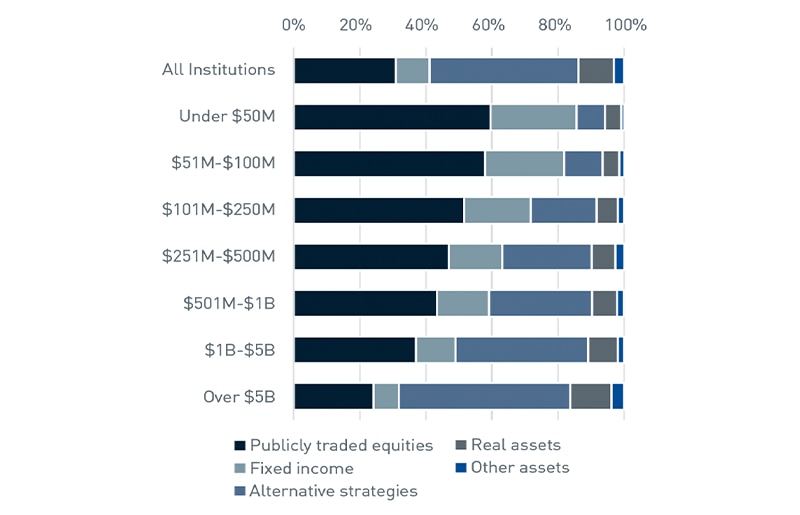
Asset allocation is widely recognized as the key driver of investment returns, with the primary purpose of an endowment portfolio being to seek return while reducing risk. The risk associated with long-term volatility in financial markets can be mitigated by the diversification of assets. Across all size cohorts, a multi-asset class strategy can be used year after year with few adjustments required.
Figure 2: 2024 Endowment Asset Allocations
Source: NACUBO
View accessible version of this chart.
| Questions for discussion: |
| How is your endowment currently leveraging diversification strategies? Do you anticipate shifting your asset allocation? |
| If falling short on target returns goals: what benchmark are you using? Does it realistically match the asset allocation and historical returns of your portfolio? |
| If meeting or exceeding target returns goals: how can you capture appreciation now to protect gains during years where target returns are not met? |
- Participating institutions withdrew a total of $30 billion from their endowments in FY24, a 6.4% increase from FY23
- The average annual effective spending rate increased to 4.8% from 4.6% in FY23
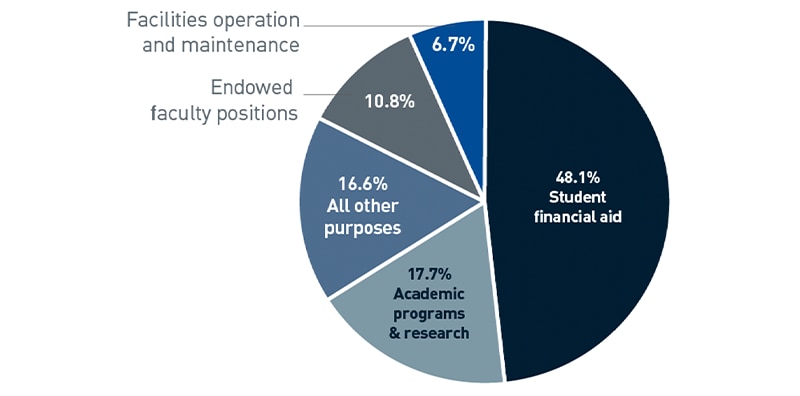
- The largest percentage of spending policy distributions (48.1%) went to student financial aid

| Questions for discussion: |
| How recently have you evaluated your spending policy? Does it allow for flexibility in unforeseen circumstances? |
| Are the development staff and financial staff effectively communicating the needs of the organization with one another? How is the development staff telling the financial story of the organization to potential donors? |
3. A heightened and changing regulatory environment means higher education leaders must keep a pulse on proposed changes and understand their potential impacts.
Both private and public higher education institutions alike are facing increased uncertainty around possible government funding cuts and new tax proposals impacting endowments. These potential budget impacts come at a time when the higher education sector is already seeing increased margin compression due to a drop in student enrollment, increased cost of operation and increased student aid expenses. Some of the proposed policy changes with the potential for impacts include:
- Higher taxation of university endowments – with lawmakers introducing bills like the Endowment Tax Fairness Act that has proposed rates of up to 21% on investment income.1
- Caps on indirect research reimbursement – In February, the National Institute of Health introduced a planned 15% cap on indirect research. If implemented, the cap would greatly affect higher education institutions with large research arms and may cause institutions to halt medical research programs or draw from endowments to cover the loss of grant funding.2
| Questions for discussion: |
| If this regulation is put in place, how will it affect your organization? |
| Is there effective communication around proposed changes to ease concerns of staff and provide direction? |
Nonprofit Strategy & Solutions Group
PNC’s Nonprofit Strategy & Solutions group serves as a dedicated partner committed to empowering nonprofit organizations to achieve their missions. By combining national expertise with local knowledge, we provide comprehensive education and advice on governance, philanthropy and financial sustainability—going beyond asset management to deliver actionable insights that address the most pressing challenges nonprofits face. With our deep community ties, practical nonprofit leadership experience and strong local market presence, we provide meaningful solutions that optimize resources and deliver a sustainable impact. For more information, contact the team at IAMNonprofitStrategy@pnc.com.
Accessible Version of Charts
| Concern | Percentage of respondents | |
| student enrollment | 23.2% | |
| fundraising | 12.0% | |
| increases in student aid expenses | 10.8% | |
| not meeting targeted returns | 10.5% | |
| long-term volatility in financial markets | 8.4% | |
| inflation | 8.2% | |
| special withdrawals due to budgetary pressures | 5.8% | |
| liquidity concerns | 4.7% | |
| alternative asset allocation | 4.5% | |
| potential impact of elections and policy changes | 3.8% | |
| All Institutions | Under $50M | $51M-$100M | $101M-$250M | $251M-$500M | $501M-$1B | $1B-$5B | Over $5B | |
| Publicly traded equities | 30.9% | 59.6% | 58.0% | 51.6% | 47.0% | 43.3% | 37.0% | 24.2% |
| Fixed income | 10.2% | 26.1% | 23.9% | 20.1% | 16.2% | 15.9% | 12.0% | 7.6% |
| Alternative strategies | 45.1% | 8.6% | 11.6% | 20.1% | 27.0% | 31.2% | 40.2% | 52.0% |
| Real assets | 10.8% | 4.9% | 5.1% | 6.4% | 7.3% | 7.5% | 9.0% | 12.5% |
| Other assets | 3.00% | 0.9% | 1.5% | 1.8% | 2.6% | 2.0% | 1.8% | 3.7% |
| Total | 100.00% | 100.10% | 100.10% | 100.00% | 100.10% | 99.90% | 100.00% | 100.00% |
| Purpose | Percent of distributions | |
| Student financial aid | 48.1% | |
| Endowed faculty positions | 10.8% | |
| Facilities operation and maintenance | 6.7% | |
| Academic programs and research | 17.7% | |
| All other purposes | 16.6% | |


