
In light of the current relatively borrower-friendly environment, we have prepared this paper to address the topic of using financial leverage to increase the reach, impact, and financial feasibility of 501(c)(6) organizations’ efforts.
For sake of clarity, we will start by identifying two common approaches: borrowing from an investment pool and borrowing against an investment pool.
As a preface, it is important to note that many organizations, especially those with restricted funds, will not easily be able to engage in either method; furthermore, the charter, investment policy statement, or other policies may also prevent borrowing in any form. We are not able to give legal advice as to the feasibility of borrowing, and suggest an organization consult with its legal services provider before taking any action.
Why Use Financial Leverage?
Primarily, 501(c)(6) nonprofit organizations’ budgets are increasingly strained due to the increasing needs of their members and missions that they serve. There are just not nearly enough resources to address every need and every cause. For example, the volatility and unpredictability of fundraising could result in the potential for an operating cash shortfall if operating and investment income is not sufficient to meet budgetary requirements.
Further complicating things, donations are increasingly coming with donor restrictions attached.
A study by the Stanford Social Innovation Review found that even the restriction on the reimbursement of indirect costs (typically 15%) is leaving nonprofits with excessive, and sometimes unexpected, bills that, in turn, can also lead to an operating cash shortfall[1] . Regardless of the cause, an organization might borrow to make up the shortfall, whether through a line of credit or a short-term loan.
The second major reason for a 501(c)(6) organization to borrow is to fund large-scale, longterm capital projects.
These projects could include a new building, major renovations, or new equipment[2] , and would likely need to be funded (at least partially) through borrowing. The loan or debt, in most cases, would have to be paid for through a combination of donations, investment income and operating income, if applicable. The major issue with this is that, given donations and investment income streams are not adequately predictable, nonprofits without substantial operating income sometimes have to pay a higher rate of interest (meaning higher cost of borrowing) than a comparable (with regard to leverage), for-profit entity would pay.
Borrowing Against an Investment Pool
The first option that we will explore is borrowing from a lender using collateral. As we discussed above, the rate of interest on a loan is often determined by the perceived riskiness of the loan and the strength of the organization’s financials (both balance sheet and profit & loss). The perceived riskiness of the loan can be affected by whether the loan is secured (by specific assets of the borrower) or unsecured (without specific assets pledged). An example of this would be an organization that pledges a portion of its endowment being able to borrow at a lower rate of interest than if it does not pledge its endowment. Factoring into the perceived riskiness is the borrower’s financials: on the balance sheet side, this relates to restricted assets, unrestricted assets, and liabilities; on the profit & loss side, this refers to whether the organization runs a net income surplus (income greater than expenses) or net income deficit (expenses greater than income) 3. An example of this would be that an organization with substantial unrestricted assets, little to no liabilities, and running a net income surplus would be able to borrow at a lower rate of interest than it would be able to if the same organization had limited unrestricted assets, high liabilities, and ran a net income deficit.
Borrowing using collateral generally takes two forms for nonprofits: the first is done by participating in a government (local, state or federal) guarantee program4; the second is done by pledging the investment assets of the nonprofit as collateral should the borrower default on the loan. This method is called “credit enhancement,” and its effect can be seen in Chart 1. The difference (spread) between borrowing at a Moody’s credit rating of AAA and at a Moody’s credit rating of BAA can range from 1-2% to nearly 5% (although a 5% difference is extremely rare). Credit enhancement (through guarantee or collateralization) essentially provides the borrower with the ability to borrow at a higher credit rating, meaning at a lower rate of interest, than they would have been able to without securing the loan. A lower rate of interest means that the organization will have a lower cost of borrowing; this, in turn, helps to increase the likelihood that the organization will be able to repay the loan in full and on time.
Chart 1: Effect of Credit Enhancement: Representative Interest Rates at Different Credit Ratings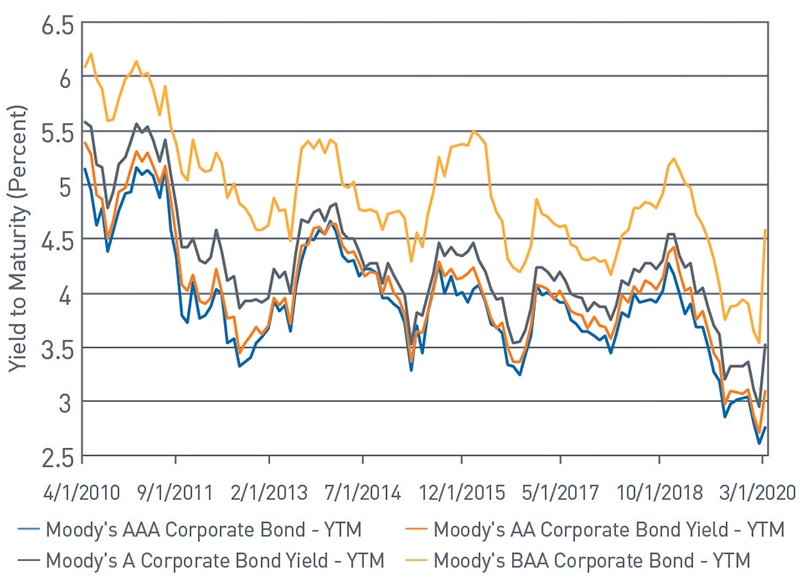
View accessible version of chart.
Borrowing From an Investment Pool
The second option that we will explore is borrowing from an organization’s investment pool. The advantage of this approach is that it is sometimes, assuming that there are not restrictions on the pool of assets, easier to get “lender approval” (meaning that the board approves the loan). From here, there are two schools of thought with regard to setting the rate of interest on the loan.
The first policy is to charge the same rate of interest as the return target for the investment pool. Using simplified math, an example of this would be adding a spending policy of 4%, inflation of 2%, and management (overhead) fees of 0.5% to determine a 6.5% rate of interest on the loan.
The second policy is to borrow using a rate of interest that is on par with similar duration securities in the fixed income portion of the organization’s portfolio. An example of this would be matching the rate of interest on a 15-year fixed-rate loan with the yield to maturity on a fixed income index with a duration of 15 years.
With both methods above, there are two major concerns with borrowing internally: first, that it reduces diversification in the portfolio; second, depending on the size of the loan relative to the size of the pool of assets, there might be concentration risk.
The upside is that the consequences of defaulting on the loan are internal, meaning that the lender does not come after assets or other forms of recompense. The organization would still lose the remaining principal of the loan, but there is also the potential for greater flexibility around repayment grace periods to prevent that scenario.
It is important to note that, broadly speaking, borrowing money from internal investment assets reduces the liquid assets of the portfolio available for distribution per the annual spending policy. There are also drawbacks to both of the methodologies discussed above: in the case of borrowing at the portfolio’s targeted return, the interest rate might be higher than what the borrower would pay from another lender (suggesting it might be better to borrow against the investment pool); in the case of borrowing at an index determined rate of interest, which is likely to be lower than the portfolio’s target return, the portfolio is subject to a higher degree of duration risk.
What is the Value Proposition to Using Financial Leverage?
We believe that the major factor or criterion for evaluating the organizational value of financial leverage is opportunity cost. For example, an organization might keep a large pool of cash or short-term investments on hand, earning minimal interest, for the potential cash outflows in a given year. This hypothetical pool of assets might be earning 1% interest in the current environment; however, if it were to be invested in a longer-term, more “endowment-like” allocation, it could target a return objective of 6%. If the cost of collateralized borrowing (assuming no tax deductibility) is 4%, and assuming the debt is equal to the size of the invested assets, the net return on that project is 2%.
This is comparable to the 1% that it would have earned as cash/short-term investments, and 0% it would have earned as an outflow. In Table 1, we illustrate this point on a four year, $10,000,000 project that starts at the end of year one.
On the left side, the money is invested for one year at 1%, resulting in $100,000; subsequently, the money is spent at the end of year one as an outflow. In this side, debt is not needed and the organization does not incur any interest costs on related debt. On the right side, the money is invested for the full five years; at the end of year one, a four-year loan is taken to fund the project. The difference we are tracking in this scenario is the investment gains/income generated by the money, net of the cost of leverage for sake of comparison.
The opportunity cost of not using financial leverage in the above scenario is roughly $2.2 million in investment income (right minus left net investment impact).
Not every scenario will be as simple as the hypothetical above, but it illustrates the value that financial leverage can unlock for a nonprofit organization. With that said, there are downside risks to its use: for example, there is the potential that the organization will not reach its return objective of 6% over a given five-year period. This would reduce the net investment impact, generally increasing the cost of the project. While we nevertheless believe that the rewards outweigh the risks, we do believe it is important to be aware of the risks.
The $10,000,000 investment could have been the purchase of a new building or facility, to fund a new industry or trade publication effort, or put toward the promotion of higher business standards and methods. The point is that as 501(c)(6) organizations are engaged in improving the lives of their members and the success of their missions, these cash outflows are going to be necessary. To us, the value proposition of financial leverage is simply minimizing the cost of these outflows while maximizing the effect of existing organizational assets.
Conclusion
Borrowing is always a difficult decision, and becomes even more complex when nonprofit organizations enter into the equation. With that said, the investment assets do have the ability to support the organization through serving as a lender or through collateralization.
If it is not possible to secure a government guarantee for a bond issue, the collateralization of the loan with the investment assets can help to lower the rate of interest on the loan (relative to an uncollateralized loan) and, unlike borrowing from the investment assets, does not immediately take away from the liquidity of the fund.
Alternatively, borrowing from the investment assets allows more flexibility and less external consequences to paying (or failing to pay) back the loan. Ultimately, your organization’s leadership and board of directors are best positioned to determine the right choice for your organization.
Table 1: Net Investment Impact
| Investment: $10,000,000 | Net Income |
Investment: $10,000,000 |
Net Income |
| Cash/Short Term Investments @ 1% for One Year |
$100,000,000 |
Long Term "Endowment-Like" Investments @ 6% for Five Years |
$3,382,255.776 |
| End of Year One: Outflow of $10,000,000 for Four Year Project |
$0.00 | Total Interest on For Year Loan of $10,000,000 @ 4% Annual Interest |
($1,038,886.29) |
| Net Investment Impact: | $100,000.00 | Net Investment Impact: |
$2,343,389.49 |
Note: Interest on loan assumes monthly payments at an APR of 4%.
Source: PNC
Please contact your PNC Representative or fill out a simple form and we will get in touch with you.
Accessible Version of Charts
Chart 1: Effect of Credit Enhancement: Representative Interest Rates at Different Credit Ratings
| Date | Moody's AAA Corporate Bond - YTM | Moody's AA Corporate Bond Yield -YTM | Moody's A Corporate Bond Yield - YTM | Moody's BAA Corporate Bond -YTM |
|---|---|---|---|---|
| 3/31/2011 | 5.13 | 5.3 | 5.54 | 6.04 |
| 3/30/2012 | 4.03 | 4.22 | 4.58 | 5.3 |
| 3/29/2013 | 3.89 | 3.95 | 4.2 | 4.77 |
| 3/31/2014 | 4.3 | 4.38 | 4.5 | 5.03 |
| 3/31/2015 | 3.45 | 3.63 | 3.8 | 4.42 |
| 3/31/2016 | 3.72 | 3.77 | 4.03 | 4.89 |
| 3/31/2017 | 3.91 | 4.02 | 4.19 | 4.61 |
| 3/30/2018 | 3.78 | 3.92 | 4.08 | 4.59 |
| 3/29/2019 | 3.68 | 3.76 | 4 | 4.73 |
| 3/31/2020 | 2.76 | 3.09 | 3.53 | 4.59 |