PNC Institutional Asset Management® has developed the donor-advised fund (DAF) portfolios based on a wide range of DAF investor investment goals and objectives. This report discusses the portfolios and key elements of their development.
We developed a series of portfolios that donors may select to help achieve their charitable giving goals and objectives. This paper outlines a process donors may follow in order to identify key considerations around their philanthropic intentions and how those considerations align with an appropriate asset allocation and investment approach. We believe following this process may help donors meet their financial gifting objectives.
Figure 1: DAF Investment Selection Process
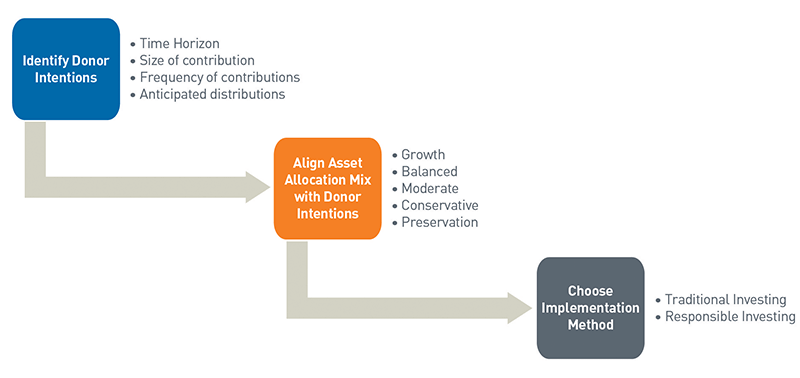
View accessible version of this chart.
I. DAF Client Profile
The profile outlined in this report is unlikely to precisely describe any one donor. Each donor has unique and potentially complex charitable giving intentions. One donor may know exactly when and how much financial support they intend to provide to an organization, while another donor may want to invest financial support today for a “rainy day” in the future. We believe having clear donor objectives (intentions) can help identify which asset allocation may be the most suitable for their particular investment objectives and constraints.
We outlined several asset allocations that may help donors align reward and risk profiles with charitable giving objectives (intentions). We followed the recommended guidelines from the CFA Institute with regard to the creation of an investment policy statement (IPS) to help donors identify their objectives (intentions) from an investment perspective. Donors should periodically review their objectives and constraints as giving intentions may change depending on the environment or the donor’s financial circumstances.
Return Objective: There is a wide range of possible asset allocation options that a donor can select, and each asset allocation has a different expected return profile.
Does the investment portfolio need to generate enough return to offset the rate of inflation (e.g., Consumer Price Index [CPI] or Higher Education Price Index [HEPI])? Does it need to grow at a particular level in excess of inflation (e.g., CPI + 2% or 3% annually)? If assets need to increase to a targeted dollar value (e.g., $10,000 today growing to $20,000 in 10 years), a donor should evaluate if their time horizon is realistic given the potential expected returns of different asset allocations and whether they are comfortable with the commensurate risk level.
There is no one-size-fits-all solution, but a donor’s intentions and time horizon can help them determine the appropriate/approximate return objective for their unique needs.
Risk Tolerance: The simple rules of thumb are:
- Longer time horizons increase the portfolio’s ability to bear risk; shorter horizons reduce ability.
- Greater liquidity requirements reduce the portfolio’s ability to bear risk; lower liquidity requirements increase the ability.
The willingness to tolerate varying degrees of market volatility across market cycles can also impact risk tolerance, but to a lesser degree than time horizon and liquidity needs, in our view.
Time Horizon: If a donor’s objective is to make a charitable grant in the near term, the investment time horizon should be shorter-term in nature and the ability to tolerate market volatility would likely be lower, all else equal.
If a donor’s objective is to grow the portfolio market value before making a grant, the time horizon would need to be longer-term in order to have enough time to grow the portfolio to meet its objectives. The longer time horizon may allow the donor to take on an asset allocation with greater reward/risk and to recover losses or drawdowns that may occur during the investment cycle.
| Investment Time Horizon | Distribution Relative to Portfolio | Distribution Frequency | Risk Tolerance Ability* |
| Short (1-3 Year) | Large % | One Time – Lump Sum | Lower |
| Short (1-3 Year) | Large % | Recurring Annual | |
| Intermediate (3-5) | Large % | One Time – Lump Sum | |
| Intermediate (3-5) | Larger % | Recurring – Annual | |
| Long (5-10) | Large % | One Time – Lump Sum | |
| Long (5-10) | Modest % | Recurring | |
| Perpetuity | Modest % (i.e.,2-3%) | Recurring | Higher |
| *Lower risk tolerance ability means less ability of the portfolio to incur market volatility and potential losses, and a greater focus on preservation of capital. Higher risk tolerance ability means greater ability to incur market volatility and potential losses in an effort to earn greater investment return over time. | |||
Liquidity Needs: The endless number of combinations of potential cash flows, as well as size and frequency of distributions, can add more complexity. Size may be determined by a fixed dollar amount or as a percent of the total portfolio. In terms of size, the greater the grant as a percent of the total portfolio (e.g., >10%), the greater the liquidity needs of the portfolio are, and the portfolio has a lower ability to tolerate risk.
Frequency may be as simple as a one-time lump sum payment made in the near term or sometime in the future. Uncertainty around the frequency of cash outflows lowers the ability to take on market risk.
Tax Considerations: When a donor makes a contribution to a DAF, the donor may receive an income tax deduction depending on the donor’s personal tax situation. Any assets contributed to the DAF become tax-exempt as the DAF program is maintained and operated exclusively by the sponsoring 501(c)(3) non profit organization. Given the tax-exempt status, any investments that might generate unrelated business taxable income should be avoided (e.g., master limited partnerships).
Legal and Regulatory: The sponsoring organization has legal control over the contribution, while the donor retains advisory privileges with respect to granting of funds and the investment of assets in the DAF subject to guidelines put in place by the sponsoring organization.
Unique Circumstances: Given the high degree of variability around time horizon and cash flows, allocations to alternative investments may be inappropriate. However, depending on a donor’s unique needs and circumstances, they may be incorporated into a DAF.
A donor might fund a DAF with a single security or a few securities which may represent all or a high percentage of the overall portfolio. If a portfolio contains a concentrated position and it cannot be liquidated, the remaining assets of the portfolio should be allocated to improve diversification. However, in the case of DAFs if securities are transferred in-kind they can be liquidated tax-free.
To summarize, the time horizon and liquidity requirements in particular have the greatest impact on managing risk in the portfolio. All else equal, a short-term investment time horizon and large outflows from a fund will lower the ability of the portfolio to take on market volatility risk, and a preservation or very conservative asset allocation would be more appropriate versus a more growth-oriented allocation. Conversely, the longer the time horizon and smaller the distributions, the greater the ability for the portfolio to take on risk and have a more growth oriented asset allocation.
II. Choosing an Asset Allocation
Once a donor has evaluated their intentions along the guidelines outlined above, the next step is to identify which asset allocation may align best with those objectives.
In Tables 2a and 2b, we have provided six sample asset allocations to equities and fixed income, as well as historical performance and risk statistics from December 31, 1979, through December 31, 2020, to help illustrate the reward and risk characteristics of each asset allocation. Given the time-sensitive nature of donor gifts, we include several downside risk measurements to help illustrate the types of losses each sample allocation historically experienced and the time it took to recover those losses.
| Reward/Risk Profile |
Asset Allocation | Total Equity | Fixed Income |
| Global Equity | A | 100.00% | 0.00% |
| Growth | B | 80.00% | 20.00% |
| Balanced | C | 60.00% | 40.00% |
| Moderate | D | 40.00% | 60.00% |
| Conservative | E | 20.00% | 80.00% |
| Fixed Income | F | 0.00% | 100.00% |
| Reward/Risk Profile |
Asset Allocation | Annualized Return | Annualized Standard Deviation | Average Drawdown | Maximum Drawdown | Maximum Drawdown Period (Yrs.) | Maximum Drawdown Recovery Period (Yrs.) |
| Global Equity | A | 11.00% | 14.90% | -6.20% | -53.40% | 1.33 | 3.92 |
| Growth | B | 10.60% | 12.10% | -5.10% | -44.40% | 1.33 | 2.17 |
| Balanced | C | 10.00% | 9.50% | -4.00% | -34.00% | 1.33 | 1.83 |
| Moderate | D | 9.30% | 7.20% | -2.70% | -22.20% | 1.33 | 1.08 |
| Conservative | E | 8.50% | 5.50% | -1.60% | -10.40% | 0.5 | 0.75 |
| Fixed Income | F | 7.50% | 5.20% | -1.80% | -9.00% | 1.25 | 0.17 |
*Source: MSCI Risk Metrics, FactSet Research Systems Inc. - SPAR
Note: Equity allocation split to 65% U.S. Equity - Russell®, 35% MSCI EAFE (1979-2000), MSCI ACWI ex USA (2000 to present). Bloomberg Barclays US Aggregate for Fixed Income
It is still worth pointing out that historically these balanced and even moderate allocation mixes have experienced double-digit drawdowns; more than a year was required to recover losses. While those drawdowns represent extremes, they highlight a level of market risk that may conflict with a donor’s grant distribution intentions if the gift is large in relation to the size of the overall portfolio and/or is meant to be made in the short term.
For donors with higher liquidity needs and shorter time horizons, asset allocation E is more conservative from an equity market volatility risk standpoint, with equity exposure of 20% or less. In primarily fixed income-oriented allocations such as these, interest rate (duration) risk becomes more of the concern than equity market volatility.
The disclaimer “past performance is not indicative of future results” certainly applies in fixed income markets given where we are today. At the current time, interest rates around the world are near zero (the United States), or even negative in some developed countries (Japan and the Eurozone). Duration/interest rate risk is at all-time highs, which makes fixed income-focused asset allocations susceptible to spikes in interest rates. It is unlikely, in our view, that fixed income allocations will be able to deliver the same level of annualized returns experienced over the last 40 years as there appears to be very little room for interest rates to move lower from current levels.
Aligning donor intentions and the reward/risk profile may help donors meet charitable goals. In summary, more conservative reward/risk profiles may be more suitable when grant activity time horizons are shorter and distributions are greater (high liquidity). More aggressive reward/risk profiles may help to grow a portfolio, but the donor must accept greater levels of market volatility that may require longer time horizons to recover in the event of a market correction. There is no one size fits all, but a donor’s intentions and time horizon can help them determine the right return and risk objective for their specific situation.
III. Implementation Considerations
Donors have unique and diverse objectives when making charitable contributions. Our investment menu provides options that are simple, yet flexible, to help donors invest contributions for near-term or longer-term grant activity.
We offer portfolios for different reward/risk objectives that come in both traditional and responsible investing implementation options. The multi-asset portfolios are comprised of both global equity and fixed income. Donors with very short-term investment horizons that wish to minimize market volatility risk may also utilize short-duration and money market options. Below we discuss the equity and fixed income components in more detail.
Traditional Investing Portfolio Solutions
The traditional investing portfolios allocate to Total Return Equity and Core Total Return Fixed Income in different multi-asset allocation mixes depending on reward/risk profiles desired by donors.
The portfolio features greater mid- and small-cap than a market-cap weighted U.S. index, which we believe can earn a return premium over large-cap equities over the long term. Real assets such as real estate investment trusts and global infrastructure provide some diversification from U.S. equity as well as some income return. The international exposure provides diversification benefits, though these allocations remain underweight relative to global market capitalizations. The portfolio may shift between growth and value over time, but generally maintains a long-term value style bias to capitalize on longer-term value premiums.
The portfolio has a willingness to take on the portfolio turnover that comes from active management — both in terms of underlying managers and tactical asset classes and manager types. We utilize high conviction, skilled managers in the portfolio and believe by combining managers who have differentiated strategies, portfolio volatility can be managed while preserving the potential for excess returns over a passive approach.
The actively managed Core Total Return Fixed Income portfolio serves as the fixed income component of our traditional investing multi-asset portfolio and is designed to maximize expected risk-adjusted return relative to the Barclays U.S. Aggregate Bond index. The portfolio features allocations to core, core-plus, and strategic active managers.
We believe active management in the fixed income space has advantages over passive in its flexibility to allocate to credit sectors and actively evaluate issues that fall below or rise above investment grade. Active managers typically underweight Treasuries, which can lead to underperformance in times of market stress. To mitigate this positioning, the portfolio includes an allocation of passive long-term U.S. Treasuries to complement our active manager’s credit exposure. We believe each manager’s style is different and contributes to the overall allocation in different ways during the stages of a business cycle.
DAF Investment Options
| Investment Name | Asset Allocation Composition |
| Total Return Equity | 100% Total Return Equity |
| Growth | 80% Total Return Equity/20% Core Total Return Fixed Income |
| Balanced | 60% Total Return Equity/40% Core Total Return Fixed Income |
| Moderate | 40% Total Return Equity/60% Core Total Return Fixed Income |
| Conservative | 20% Total Return Equity/80% Core Total Return Fixed Income |
| Core Fixed Income | 100% Core Total Return Fixed Income |
| Investment Name | Asset Allocation Composition |
| RI Total Return Equity | 100% RI Total Return Equity |
| RI Growth | 80% RI Total Return Equity/20% RI Fixed Income |
| RI Balanced | 60% RI Total Return Equity/40% RI Fixed Income |
| RI Moderate | 40% RI Total Return Equity/60% RI Fixed Income |
| RI Conservative | 20% RI Total Return Equity/80% RI Fixed Income |
| RI Fixed Income | 100% RI Fixed Income |
| Investment Name | Asset Allocation Composition |
| Short Duration | 100% Vanguard Ultra-Short Term Bond (VUSFX) |
| Money Market | 100% Fidelity Investments Institutional MM Govt. Portfolio (FIGXX) |
Responsible Investing Portfolio Solutions
- ESG Ratings Tilting — Tilting toward companies with the strongest, most positive ESG characteristics or factors and away from the lowest, most negative scores based on third-party data.
- ESG Integration — Systematically evaluating and including material ESG factors, risks and opportunities into the analysis of the fundamental profile and valuation of a company.
- Thematic or Sustainable Focus — Investing in companies whose business activities are aligned with specific themes or where sustainability plays a significant role in security selection and investment process.
Preservation Options
The Short Duration option is the Vanguard Ultra-Short-Term Bond Fund (VUSFX), which is a low duration bond strategy that seeks to generate income with a focus on capital preservation. The fund is managed against the Bloomberg Barclays Bellwether 1-year index and primarily invests in investment grade corporate credit and high-quality structured credit, with the remaining balance comprised of government securities, foreign bonds and cash. While the portfolio does not target a stable net asset value, the fund has historically not experienced dramatic fluctuations of more than 1-1.5% since inception in 2014.
The money market option is the Fidelity Investments Money Market Government Portfolio (FIGXX), which seeks to obtain a high level of current income as consistent with the preservation of principal and liquidity within the limitations prescribed for the fund. The advisor normally invests at least 99.5% of the fund’s total assets in cash, U.S. government securities and/or repurchase agreements that are collateralized fully. The advisor stresses maintaining a stable $1.00 share price, liquidity and income. Although the fund seeks to preserve the $1.00 per-share value, it cannot guarantee it will do so and an investment in the fund is not insured or guaranteed by the FDIC or any other government agency.
Please see additional fund disclosures for more detail before making an investment choice.
Summary
- Each donor has unique and potentially complex charitable giving goals and objectives. Donors should periodically reevaluate their portfolio relative to their goals.
- There is no one size fits all, but a donor’s gifting intentions and time horizon can help them determine the right return and risk objective for their specific situation.
- More conservative reward and risk profiles may be more suitable for shorter-term gifting time horizons and greater distributions (high liquidity).
- More aggressive reward/risk profiles may help to grow a portfolio, but the donor must accept greater levels of market volatility that may require longer time horizons to recover from in the event of a market correction.
Accessible Version of Charts
- Time Horizon
- Size of Contribution
- Frequency of Contributions
- Anticipated Contributions
- Growth
- Balanced
- Moderate
- Conservative
- Preservation
Step 3: Choose Implementation Method
- Traditional Investing
- Responsible Investing