Corporate balance sheets hold a variety of financial assets. Understanding the roles of these different pools of capital is integral to navigating ever-changing macroeconomic conditions.
Shorter-term asset pools (e.g., operating or reserve cash) are typically invested in options with minimal principal risk and a liquidity emphasis (e.g., money market funds and short-term income vehicles). However, firms with sufficient near-term resources have the flexibility to consider a strategic asset pool meant for longer-term investment.
At PNC Institutional Asset Management® (PNC IAM), our Enterprise Financial Modeling solution provides corporations with resources to enhance decision-making and improve long-term outcomes. This framework unites operating strategy, financial health and investment strategy across different pools of assets on the balance sheet.
We find that strategic investment assets can have a significant impact on organizational health, including enterprise liquidity and bottom-line profitability, and can play a key role in creating shareholder value.
How does Enterprise Financial Modeling seek to enhance decision-making?
Enterprise Financial Modeling guides clients through a four-step process. We acquire a detailed understanding of a corporation’s goals to ultimately implement and monitor a customized investment strategy.
Step 1: Organizational Goals & Projections
Our modeling workflow begins with a questionnaire-guided discovery process to understand the role investment assets play in determining enterprise financial health. We explore key metrics that measure financial health, permissible asset classes, and planned spend from investment assets, along with additional topics relevant to an optimized investment strategy.
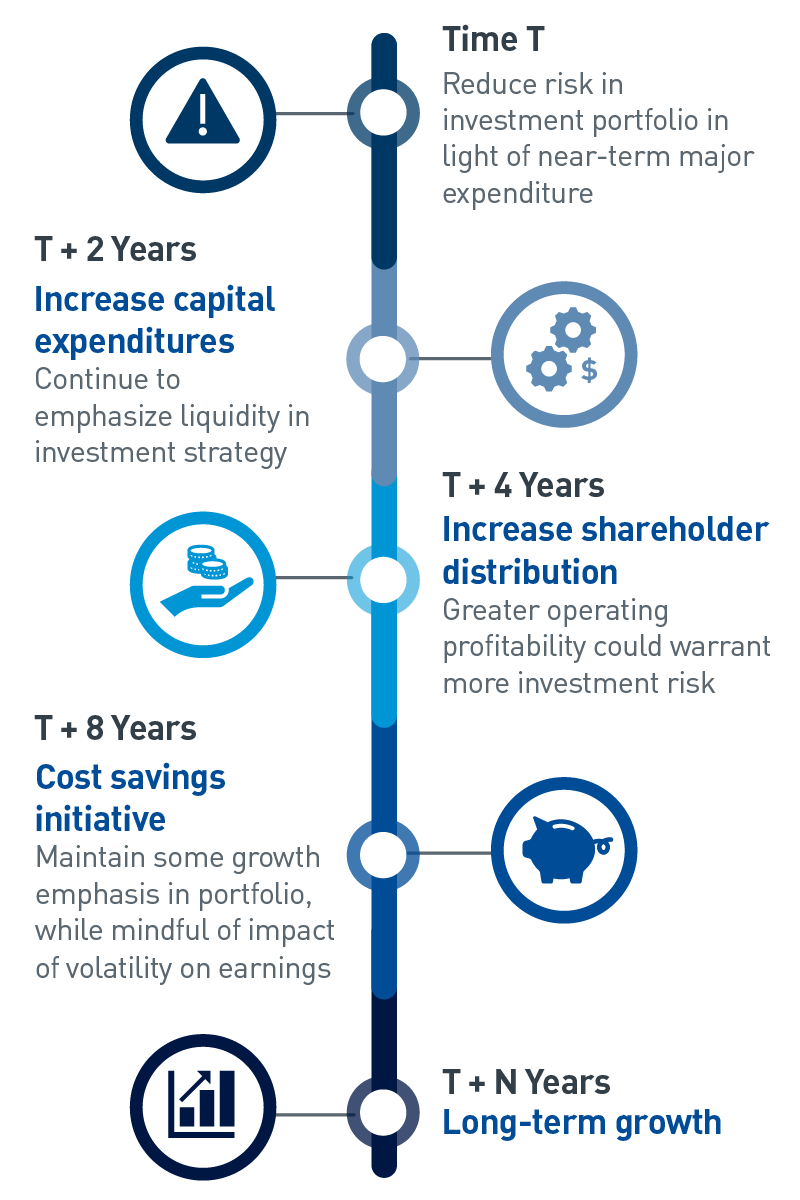
Reviewing our client’s strategic plans and financial projections allows us to refine our understanding of the organization’s financial health. This forward-looking analysis, which includes discussion of planned financial commitments (Chart 1), provides the necessary foundation to prepare a recommendation.
Chart 1: Sample Timeline of Financial Commitments
For illustrative purposes only.
View accessible version of this chart.
Step 2: Enterprise Financial Analysis
Step two marries investment assets with financial health. We analyze the influence of market volatility and different strategic asset allocation profiles on the corporation’s financial outlook. This includes examining how favorable or challenging market environments and different investment risk postures within those environments might affect balance sheet liquidity, fixed charge coverage ratio[1] and other key financial metrics.
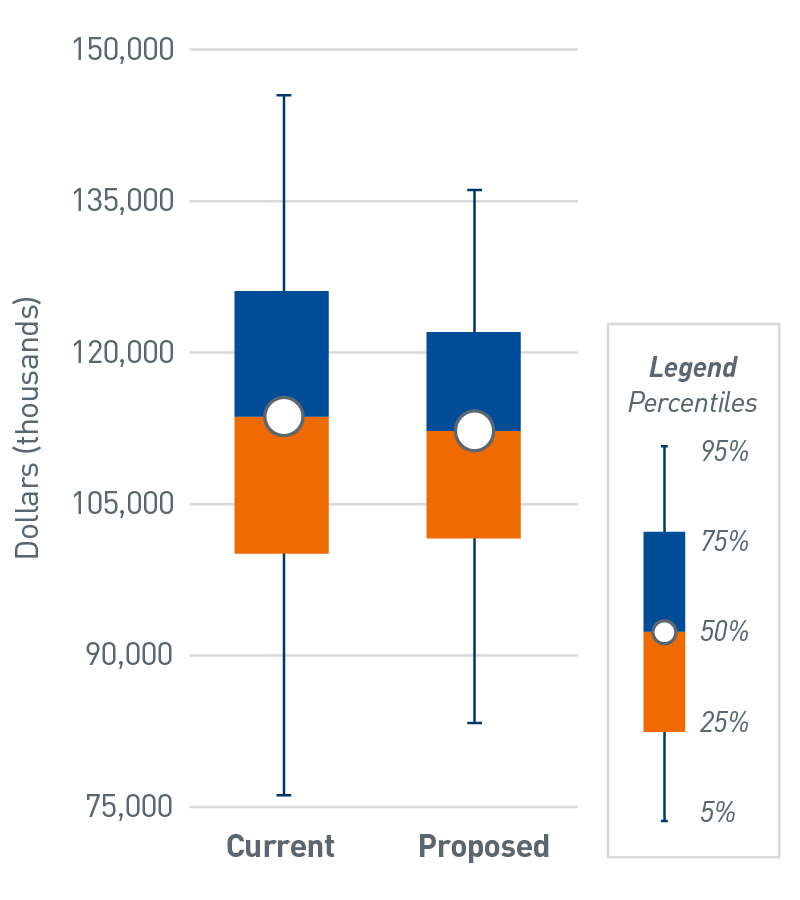
Chart 2 illustrates the output from our scenario analysis of a different key metric, net other income[2], across two different investment strategies. In this example, the magnitude of downside risk is curtailed as the existing strategy is reallocated into a better diversified portfolio. Likewise, we also consider the financial impact of capital spending funded from investment assets or the opportunity to invest debt proceeds in the long-term investment portfolio. These insights can equip organizational leaders to better comprehend their firms’ ability to tolerate investment risk and quantify the financial effect of changing investment strategy.
For illustrative purposes only.
View accessible version of this chart.
Step 3: Customized Investment Strategy
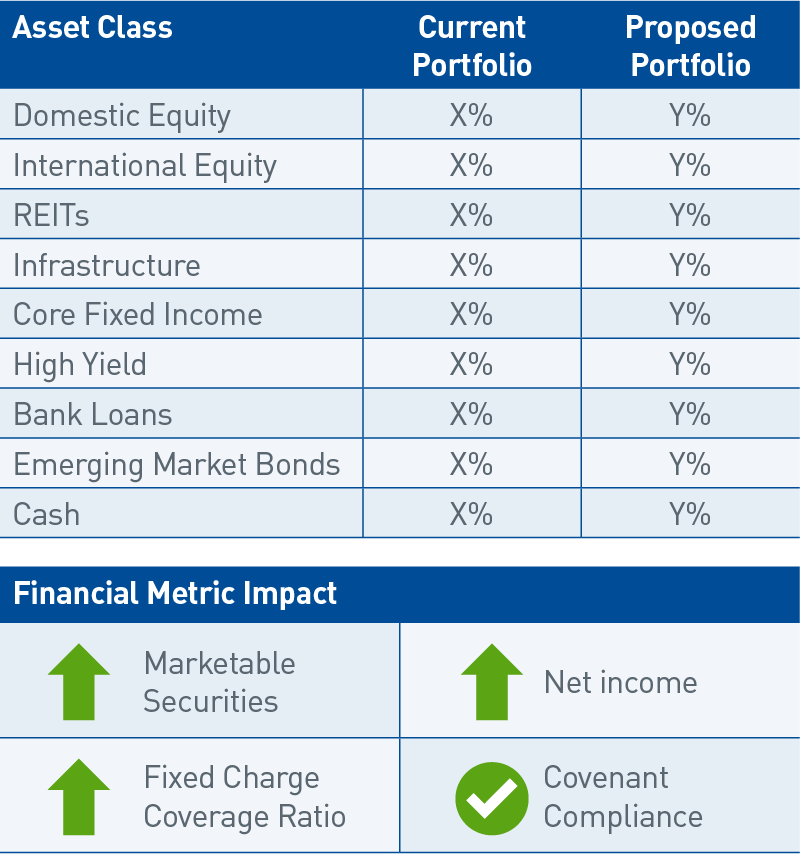
With foundational knowledge of the business and a keen understanding of how investment strategy impacts broader financial health, we tailor a recommendation around improving the probability of achieving targeted financial metric outcomes (Chart 3).
Chart 3: Sample Recommendation
For illustrative purposes only.
View accessible version of this chart.
For example, an organization may want to understand the degree to which investment assets can help provide liquidity for a capital spending project, versus utilizing debt financing. Another firm may look to achieve capital growth to lower its leverage ratio[3]. No matter the objectives, we aim to identify the optimal asset allocation that most efficiently balances return needs with the appropriate risk budget.
Step 4: Implementation & Oversight
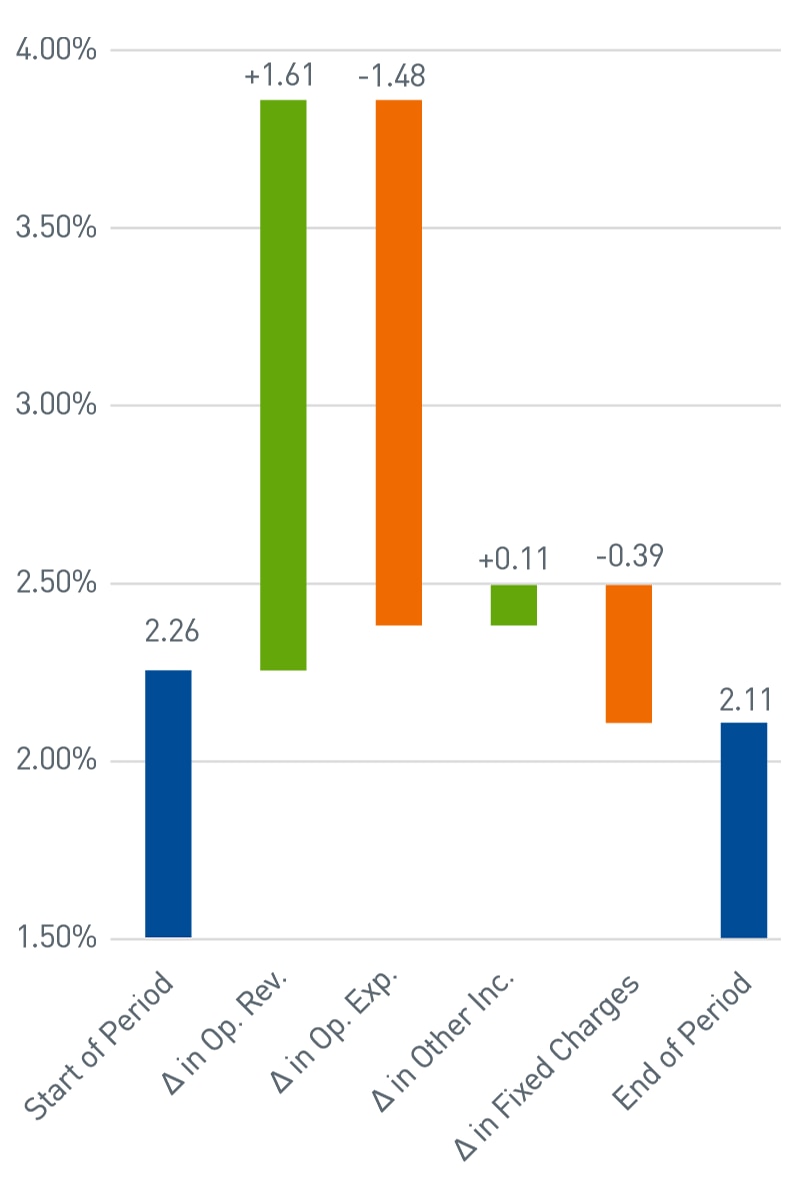
In the last step, we implement the customized investment strategy. This entails updating the investment policy statement to reflect clearly defined guidelines and concrete risk parameters. Ongoing monitoring, typically delivered through periodic reporting, is a critical check to ensure the investment strategy remains appropriate. We track how key financial metrics have changed over time (Chart 4).
These measures remain benchmarks for organizational health and are influenced by financial market volatility. When a change in goals, operating performance or other material factor occurs, we maintain an ongoing dialog with our clients, adjusting the investment strategy as needed.
Chart 4: Fixed Charge Coverage Ratio
For illustrative purposes only.
View accessible version of this chart.
Accessible Version of Charts
Chart 1: Sample Timeline of Financial Commitments
| Timeline of Financial Commitments | ||
| Time T | Reduce risk in investment portfolio in light of near-term major expenditure | |
| T +2 years | Increase capital expenditures | Continue to emphasize liquidity in investment strategy |
| Increase shareholder distribution | Greater operating profitability could warrant more investment risk | |
| T + 8 Years | Cost savings initiative | Maintain some growth emphasis in portfolio, while mindful of impact of volatility on earnings |
| T + N Years | Long-term growth | |
| Current | Proposed | |
| 95th Percentile | $ 145,465 | $ 136,115 |
| 75th Percentile | $ 126,073 | $ 122,009 |
| 50th Percentile | $ 113,660 | $ 112,243 |
| 25th Percentile | $ 100,095 | $ 101,595 |
| 5th Percentile | $ 76,149 | $ 83,349 |
Chart 3: Sample Recommendation
| Asset Class | Current Portfolio | Proposed Portfolio |
| Domestic Equity | X% | Y% |
| International Equity | X% | Y% |
| REITs | X% | Y% |
| Infrastructure | X% | Y% |
| Core Fixed Income | X% | Y% |
| High Yield | X% | Y% |
| Bank Loans | X% | Y% |
| Emerging Market Bonds | X% | Y% |
| Cash | X% | Y% |
Chart 4: Fixed Charge Coverage Ratio
| Beginning of Period | Δ in Ratio Due to Δ in Operating Revenues | Δ in Ratio Due to Δ in Operating Expenses | Δ in Ratio Due to Δ in Other Income | Δ in Ratio Due to Δ in Fixed Charges | End of Period | |
| Fixed Charge Coverage Ratio | 2.26x | 3.87x | 2.39x | 2.50x | 2.11x | 2.11x |
| Δ in Ratio | +1.61x | -1.48x | +0.11x | -0.39x |


