Global equity markets hit an all-time high in the second quarter, delivering one of the best first halves of a year in the past 20 years. Even fixed income, which has struggled to generate positive returns throughout the multi-year equity market rally, showed a positive total return for the quarter, with the Bloomberg U.S. Aggregate Index returning 0.1%, thanks to its nearly 5.0% yield (Figure 1).
Figure 1: Second Quarter 2024 Returns
Market concentration returned in the second quarter
|
2Q24 |
Apr |
May |
Jun |
U.S. Equity |
|
|
|
|
Russell 3000® |
3.2 |
-4.4 |
4.7 |
3.1 |
S&P 500® |
4.3 |
-4.1 |
5.0 |
3.6 |
WisdomTree US Quality Div Growth |
2.9 |
-4.1 |
4.0 |
3.1 |
MSCI USA Minimum Volatility |
0.7 |
-3.7 |
2.7 |
1.8 |
S&P 500 Equal Weight® |
-2.6 |
-4.9 |
2.8 |
-0.5 |
S&P 500 Value® |
-2.1 |
-4.3 |
3.0 |
-0.7 |
S&P 500 Growth® |
9.6 |
-3.9 |
6.6 |
7.0 |
S&P MidCap 400 |
-3.4 |
-6.0 |
4.4 |
-1.6 |
S&P MidCap 400 Value® |
-3.5 |
-6.0 |
4.7 |
-1.9 |
S&P MidCap 400 Growth® |
-3.4 |
-6.0 |
4.1 |
-1.3 |
Russell 2000® |
-3.3 |
-7.0 |
5.0 |
-0.9 |
Russell 2000 Value® |
-3.6 |
-6.4 |
4.7 |
-1.7 |
Russell 2000 Growth® |
-2.9 |
-7.7 |
5.4 |
-0.2 |
MSCI USA IMI/Real Estate |
-2.2 |
-8.0 |
4.5 |
1.8 |
International Equity |
|
|
|
|
MSCI ACWI Ex USA IMI |
0.9 |
-1.7 |
2.9 |
-0.2 |
MSCI World Ex USA |
-0.6 |
-2.7 |
3.8 |
-1.7 |
MSCI World ex USA Quality |
0.3 |
-3.6 |
4.0 |
0.0 |
MSCI World Ex USA Value |
-0.2 |
-1.3 |
4.0 |
-2.8 |
MSCI World Ex USA Growth |
-0.9 |
-3.9 |
3.6 |
-0.5 |
MSCI World Ex USA Small Cap |
-1.6 |
-2.9 |
4.4 |
-2.9 |
MSCI EM IMI |
5.1 |
0.7 |
0.6 |
3.8 |
Fixed Income |
|
|
|
|
Bloomberg U.S. Aggregate |
0.1 |
-2.5 |
1.7 |
0.9 |
Bloomberg Municipal |
0.0 |
-1.2 |
-0.3 |
1.5 |
Bloomberg U.S. Corporate High Yield |
1.1 |
-0.9 |
1.1 |
0.9 |
Bloomberg EM USD Aggregate |
0.7 |
-1.6 |
1.7 |
0.6 |
Source: Morningstar Inc.; Data as of 6/30/24
Despite the strength of equity market returns, investor sentiment remains tepid. The AAII Investor Sentiment Survey is well below the 2021 highs of this business cycle. What’s going on?
The biggest challenge, in our view, is ongoing concentrated market leadership within mega-cap stocks, which are experiencing outsized earnings growth from artificial intelligence (AI) innovation, amid a slowing global economy. In the United States, GDP growth decelerated in the last two quarters, and consensus does not expect it to materially reaccelerate until the second half of 2025. As a result, we remain cautious of the narrative that central bank interest rate cuts are positive for markets; historically they occur when economic growth is weakening.
For example, from June 5, when the Bank of Canada cut its policy rate, through the end of the month, the MSCI Canada Index was down more than 70 basis points. The European Central Bank made history by cutting its policy rate before the Fed for the first time on June 6, but it too was viewed negatively, with the MSCI Europe Index down nearly 4% from June 6 through month end.
Key Theme Recap
Market concentration narrows: The MSCI All Country World Index delivered a 3% return in the second quarter; however, 80% of that return can be attributed to just three AI-related U.S. mega-cap stocks. In fact, U.S. small- and mid-cap, as well as developed international large- and small-cap equities were all down for the quarter. Performance was almost entirely driven by the largest companies with the strongest earnings growth, confirming our view that we are in the later innings of the business cycle.
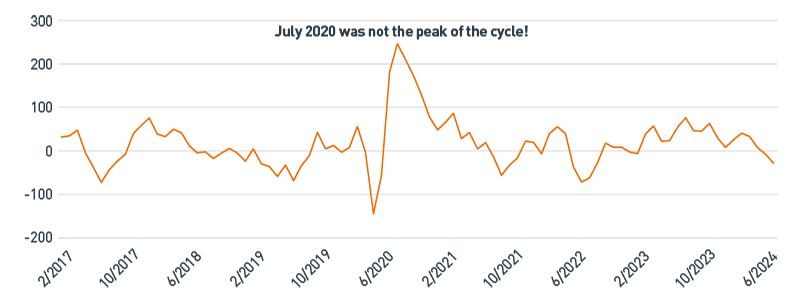
Negative economic surprises are not a concern: The Citi U.S. Economic Surprise Index, which tracks economic data compared to consensus estimates, ended the quarter at its lowest level in nearly two years (Figure 2). To some, this may suggest the business cycle is rapidly weakening. We, however, view the index as a gauge of consensus economic sentiment and not as a leading indicator. We try to take a holistic view of what various economic data suggest about the path of the business cycle. While current economic data is not reaccelerating, it is not rapidly declining either. Initial jobless claims resemble their seasonal summertime weakness, and the ISM® Services New Orders index is still at expansion levels on a rolling three-month basis. However, the Consumer Price Index excluding food, energy and housing costs — known as “supercore” inflation” — remains elevated relative to history at 4.8% on a rolling three-month basis. Each datapoint informs our mosaic, which continues to point to a slowing, but still growing, economy.
Figure 2: Citi U.S. Economic Surprise Index
Economic surprises are a gauge of sentiment, not the outlook
Source: Bloomberg L.P.; Data as of 6/30/24
View accessible version of this chart.
With quality, you get what you pay for: In a concentrated market, when the business cycle is in a slowing expansion phase, we continue to favor quality allocations across the multi-asset universe. While valuations for quality stocks appear high relative to the rest of the market, they remain supported by earnings growth. The same cannot be said about lower-valuation stocks, which may prove to be “cheap” for a reason. Second quarter earnings season is expected to finally end the six consecutive quarters of negative earnings growth for the S&P 500, excluding the “Magnificent 7” mega-cap stocks, suggesting a possible earnings reacceleration is underway. However, underlying revisions for the rest of the index remain negative, suggesting improving year-over-year comparisons are the primary reason growth rates appear positive.
Given the strong move higher by mega-cap leadership in the second quarter, we would not be surprised to see a potential pullback alongside increased volatility. We will continue navigating 2024 with our investment process as our guide, focusing on the business cycle, valuations and technical indicators.
Which Asset Classes Led in Q2?
Emerging Market Equity
Our thesis: Emerging markets (EM) account for about 40% of global GDP, 35% of global consumption and 75% of global economic growth, yet EM only comprises 8% of global equities. We continue to believe demographic trends, long-term economic growth potential and the multi-year earnings outlook in EM remain strong supporting trends for the asset class.
What worked in the quarter: EM equities were driven by growth stocks in Taiwan and China. Taiwan’s contribution came almost entirely from Taiwan Semiconductor Manufacturing Company Limited, whose increase during the quarter accounted for nearly 35% of the MSCI EM index total return. China’s Financials sector responded favorably to expectations that relief for the troubled real estate market may be addressed at the Third Plenum conference in July.
Looking ahead: More than 80% of the EM index is composed of just five countries, with China being by far the largest by market capitalization. While China’s economic data appears to be forming a trough, it has yet to show promising signs of a rebound, whereas other leading countries in the index are delivering economic and earnings growth rates comparable to, or stronger than, the United States.
U.S. Large-cap Equity
Our thesis: We believe the U.S. large-cap asset class is the long-term growth and innovation engine of public equities given its overall sustainable, high-quality fundamental characteristics.
What worked in the quarter: The S&P 500 hit a new high nine times during the quarter. The Information Technology sector accounted for 95% of the index’s returns, driven by the three largest companies: Microsoft Corp., Apple Inc. and NVIDIA Corp.
Looking ahead: We believe the forward path of inflation and interest rates will continue to influence corporate earnings in the near to medium term. Despite current levels of restrictive monetary policy, macroeconomic factors, such as consumer spending and the tight labor market, remain tailwinds for the asset class.
High Yield Fixed Income
Our thesis: Over the course of a business cycle, we expect high yield (HY) to outperform core fixed income. Traditionally, the asset class also has a stronger correlation with equity markets than with the direction of interest rates. Thus, we believe the diversification benefit of HY is an important consideration for fixed income investors.
What worked in the quarter: HY outperformed core fixed income for the second consecutive quarter, as improving economic data lifted yields, and longer-duration strategies lagged.
Looking ahead: Despite a modest improvement in fundamentals, we expect headwinds for HY to emerge later in the year should issuers be forced to roll over maturing debt at higher interest rates. Additionally, valuations continue to richen as HY spreads sit near cycle lows.
Which Asset Classes Lagged in Q2?
U.S. Mid-cap Equity
Our thesis: We believe in the long-term benefit of the mid-cap premium and its associated growth prospects. Additionally, mid-cap should benefit from its U.S.-centric revenue exposure over the long term. As such, we maintain a small overweight asset allocation to mid-cap as it combines growth and stability.
What happened in the quarter: Mid-cap equities pulled back relative to large cap as expectations for interest rate cuts waned, and investor sentiment shifted toward “higher-for-longer” rates given the resilient U.S. economy and labor market. Higher interest rates will be a headwind to mid-cap companies’ operating margins and earnings, and pressured more interest-rate-sensitive sectors, such as Consumer Discretionary, Industrials, Materials and Financials.
Looking ahead: If the odds of the United States achieving a soft economic landing continue to improve, mid-cap valuations may have room to expand as they are currently below their longer-term averages, based on price-to-earnings (P/E) and price-to-free-cash-flow.
U.S. Small-cap Equity
Our thesis: We believe in the long-term benefit of the small-cap premium and its associated growth prospects. As such, we maintain a small overweight asset allocation to small cap.
What happened in the quarter: Small-cap equities pulled back as manufacturing data continued to disappoint. Given the backdrop of slow global manufacturing activity, high interest rates and elevated inflation, small-cap equities face material headwinds, particularly as Industrials is the index’s largest sector by market-cap weight at 17%.
Looking ahead: If the U.S. economy can remain resilient, small-cap valuations may have room to expand as the forward P/E multiple of 21.7 times (x) sits just above its long-term average of 21.3x. However, markets are pricing in high expectations for the Russell 2000 in 2024 as earnings are expected to grow more than 13% for the year.
International Developed Small Cap
Our thesis: We believe in the long-term benefit of a small-cap premium for developed international markets. Unlike developed international large cap, small-cap companies are typically found outside core Europe and offer much stronger growth prospects, acting as the innovation engine for countries such as Japan, the U.K. and Canada.
What happened in the quarter: International small cap sold off more than the broad developed international market. Softening economic growth abroad, sticky inflation and the disappointing demand recovery in China weighed on performance. The largest detractors from performance were Consumer Discretionary, Real Estate and Industrials, as well as the index’s exposure to Japan, which has faced headwinds given weakness in the yen.
Looking ahead: From a valuation and earnings growth perspective, we believe international small cap remains attractive relative to international large cap, as it has much higher weightings in sectors with high growth potential.
Accessible Version of Charts
Figure 1: Second Quarter 2024 Returns
Market concentration returned in the second quarter
|
2Q24 |
Apr |
May |
Jun |
U.S. Equity |
|
|
|
|
Russell 3000® |
3.2 |
-4.4 |
4.7 |
3.1 |
S&P 500® |
4.3 |
-4.1 |
5.0 |
3.6 |
WisdomTree US Quality Div Growth |
2.9 |
-4.1 |
4.0 |
3.1 |
MSCI USA Minimum Volatility |
0.7 |
-3.7 |
2.7 |
1.8 |
S&P 500 Equal Weight® |
-2.6 |
-4.9 |
2.8 |
-0.5 |
S&P 500 Value® |
-2.1 |
-4.3 |
3.0 |
-0.7 |
S&P 500 Growth® |
9.6 |
-3.9 |
6.6 |
7.0 |
S&P MidCap 400 |
-3.4 |
-6.0 |
4.4 |
-1.6 |
S&P MidCap 400 Value® |
-3.5 |
-6.0 |
4.7 |
-1.9 |
S&P MidCap 400 Growth® |
-3.4 |
-6.0 |
4.1 |
-1.3 |
Russell 2000® |
-3.3 |
-7.0 |
5.0 |
-0.9 |
Russell 2000 Value® |
-3.6 |
-6.4 |
4.7 |
-1.7 |
Russell 2000 Growth® |
-2.9 |
-7.7 |
5.4 |
-0.2 |
MSCI USA IMI/Real Estate |
-2.2 |
-8.0 |
4.5 |
1.8 |
International Equity |
|
|
|
|
MSCI ACWI Ex USA IMI |
0.9 |
-1.7 |
2.9 |
-0.2 |
MSCI World Ex USA |
-0.6 |
-2.7 |
3.8 |
-1.7 |
MSCI World ex USA Quality |
0.3 |
-3.6 |
4.0 |
0.0 |
MSCI World Ex USA Value |
-0.2 |
-1.3 |
4.0 |
-2.8 |
MSCI World Ex USA Growth |
-0.9 |
-3.9 |
3.6 |
-0.5 |
MSCI World Ex USA Small Cap |
-1.6 |
-2.9 |
4.4 |
-2.9 |
MSCI EM IMI |
5.1 |
0.7 |
0.6 |
3.8 |
Fixed Income |
|
|
|
|
Bloomberg U.S. Aggregate |
0.1 |
-2.5 |
1.7 |
0.9 |
Bloomberg Municipal |
0.0 |
-1.2 |
-0.3 |
1.5 |
Bloomberg U.S. Corporate High Yield |
1.1 |
-0.9 |
1.1 |
0.9 |
Bloomberg EM USD Aggregate |
0.7 |
-1.6 |
1.7 |
0.6 |
Source: Morningstar Inc.; Data as of 6/30/24
Figure 2: Citi U.S. Economic Surprise Index
Economic surprises are a gauge of sentiment, not the outlook
Date |
Citi US Economic Surprise Index |
6/30/2024 |
-28.5 |
2/29/2024 |
40.6 |
10/31/2023 |
63.4 |
6/30/2023 |
54.4 |
2/28/2023 |
38.6 |
10/31/2022 |
8.1 |
6/30/2022 |
-71.6 |
2/28/2022 |
40.1 |
10/29/2021 |
-16.1 |
6/30/2021 |
18.8 |
2/26/2021 |
86.5 |
10/30/2020 |
128.9 |
6/30/2020 |
181.2 |
2/28/2020 |
56.2 |
10/31/2019 |
4.7 |
6/28/2019 |
-68.3 |
2/28/2019 |
-29.8 |
10/31/2018 |
5.4 |
6/29/2018 |
-4.9 |
2/28/2018 |
32.9 |
10/31/2017 |
40.2 |
6/30/2017 |
-72.6 |
2/28/2017 |
34.7 |
Source: Bloomberg L.P.; Data as of 6/30/24