U.S. inflation continues to surprise to the upside as the Consumer Price Index reached 7.9% in February, well above its 40-year average of 2.8%. Adding to rising inflation pressures, the White House recently announced a ban on Russian energy imports, and other countries such as Canada and the United Kingdom have made similar announcements as well. While the United States only imports 3% of its oil from Russia and is a net-exporter of natural gas and coal, the indirect impact of supply disruptions related to the Ukraine invasion could lead to elevated energy prices, adding additional pressure to inflation. The timing is inopportune as inflation pressures from global supply chain bottlenecks had just begun to stabilize. Even Federal Reserve (Fed) Chairman Jerome Powell mentioned at the March Federal Open Market Committee press conference that lower inflation “may take longer than we like.” In this market commentary, we highlight our views on oil, inflation and the implications for investors.
Oil Market Technicals
Nearly two years ago, oil prices turned negative due to a collapse in demand from the pandemic. Today’s environment is a sharp contrast to that period as investors face significant uncertainty regarding global oil supplies due to the Russian invasion of Ukraine. However, we believe oil markets may be pricing in an overly negative scenario. For example, the spot price of West Texas Intermediate crude reached a 14-year high of $125 per barrel on March 8; however, the price of the futures contract six months out was just $106. While both prices are elevated relative to history, the $19 spread between the two contracts is the widest in 15 years. Barring another negative shock to oil supplies, we do not believe these elevated prices are sustainable over the longer term. In the short term, our technical analysis indicates oil prices could stay in an uptrend, leading to an extended period of high prices and potentially influencing the business cycle and the earnings outlook (Figure 1).
Figure 1. West Texas Intermediate Crude Spot Price ($)
Oil prices could fall to $80 per barrel and still be in an uptrend
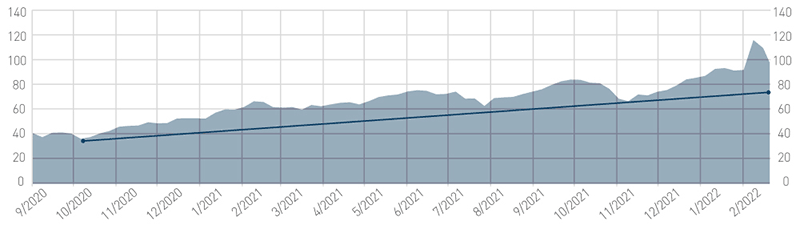
As of 3/16/2022. Source: Bloomberg, L.P.
View accessible version of this chart.
Oil Fundamentals
Oil supply and demand has been balanced over the last two quarters as the major oil producers among OPEC+ (the 13 OPEC countries and 10 other oil-producing nations, including Russia) have resisted increasing oil production coming out of the pandemic. At the March 2 OPEC+ meeting, the group reaffirmed its increase of 400,000 barrels of oil equivalent per day, even in the face of potential supply issues due to the Ukraine conflict, as members look to take advantage of the highest oil prices in 14 years. Should supply gaps arise from Russia, some OPEC+ members may be unable to increase supply without reliable infrastructure or face other barriers to ramping up production (Figure 2). For example, both Iran and Venezuela would need sanctions lifted, and then a resumption of production would take weeks if not months to return to prior peak levels. Other countries such as Angola and Nigeria have seen production decline in recent years due to deteriorating infrastructure, causing challenges to increasing production.
For traditional investments, a bear market is typically defined as a 20% correction. By that same measure, the Bloomberg Galaxy Crypto Index (BGCI) would have suffered two such periods in 2021 alone! Despite those sharp declines, the BGCI delivered a return for the year of more than 150%. Continuing the comparison with traditional investments, a greater than 50% pullback would be a signal of economic collapse. For crypto, a pullback of that magnitude is merely a typical drawdown. Over the five-year history of the BGCI, the median calendar year drawdown was 59% and ranged from 39% to 88% — the volatility of crypto markets cannot be overstated. At times, cryptos have produced enticing returns, but they also carry outsized levels of risk.
Rather than focusing on price fluctuations, we approach crypto analysis using our Business Cycle – Valuations – Technicals investment process framework to assess the health of the market. Regarding the crypto business cycle, instead of analyzing measures like GDP growth, industrial production or retail sales, we believe the crypto business cycle is centered on all-important network effects. Using bitcoin as a proxy for crypto markets, the number of longer-term users has been increasing in recent weeks as seen by an increase in the number of users holding bitcoin for at least a year. We believe this is important because it indicates the strength of the network is increasing and therefore should be less influenced by the impact from short-term speculators.
Figure 2. Oil Production and Inventories (Millions of barrels per day
Not counting on spare capacity to lower oil prices
|
Avg. 2018 |
Avg. 2019 |
Avg. 2020 |
Avg. 2021 |
Jan. 2022 |
Growth 2018-2022 |
Implied Spare Capacity |
Max 2018-2022 |
OECD |
29.9 |
31.5 |
30.6 |
31.0 |
32.4 |
9% |
0.6 |
33.1 |
U.S. |
17.9 |
19.5 |
18.6 |
18.9 |
19.8 |
11% |
1.3 |
20.5 |
Canada |
5.3 |
5.5 |
5.2 |
5.6 |
5.9 |
10% |
0.0 |
5.9 |
Mexico |
2.1 |
1.9 |
1.9 |
1.9 |
2.0 |
-5% |
0.2 |
2.2 |
Other OECD |
4.6 |
4.6 |
4.8 |
4.7 |
4.8 |
4% |
0.2 |
5.0 |
Non-OECD |
70.5 |
68.8 |
63.2 |
64.4 |
66.6 |
-6% |
4.7 |
71.3 |
OPEC |
36.7 |
34.6 |
30.7 |
31.6 |
33.4 |
-9% |
3.7 |
37.1 |
Russia |
11.4 |
11.5 |
10.5 |
10.8 |
11.3 |
-1% |
0.4 |
11.7 |
China |
4.8 |
4.9 |
4.9 |
5.0 |
5.0 |
6% |
0.0 |
5.1 |
Other Non-OECD |
17.7 |
17.8 |
17.2 |
17.1 |
16.8 |
-5% |
-1.5 |
15.3 |
Total World Production |
100.4 |
100.3 |
93.8 |
95.4 |
99.0 |
-1% |
3.2 |
102.2 |
Producers with Highest Implied Spare Capacity |
||||||||
Saudi Arabia |
10.4 |
9.8 |
9.2 |
9.1 |
9.9 |
-5% |
1.7 |
11.6 |
Iran |
3.5 |
2.3 |
2.0 |
2.4 |
2.5 |
-29% |
1.3 |
3.8 |
U.S. |
10.9 |
12.3 |
11.3 |
11.2 |
11.6 |
6% |
1.3 |
13.0 |
Brazil |
3.4 |
3.7 |
3.8 |
3.7 |
3.2 |
-5% |
1.1 |
4.3 |
Venezuela |
1.4 |
0.8 |
0.5 |
0.6 |
0.7 |
-53% |
1.0 |
1.6 |
UAE |
2.9 |
3.1 |
2.8 |
2.7 |
2.9 |
-1% |
0.9 |
3.8 |
Iraq |
4.6 |
4.7 |
4.1 |
4.1 |
4.3 |
-6% |
0.6 |
4.9 |
Angola |
1.6 |
1.4 |
1.2 |
1.1 |
1.1 |
-29% |
0.5 |
1.6 |
Nigeria |
1.6 |
1.7 |
1.5 |
1.3 |
1.3 |
-20% |
0.5 |
1.8 |
Kuwait |
2.8 |
2.7 |
2.4 |
2.4 |
2.6 |
-6% |
0.4 |
3.0 |
Top Spare Capacity Producers |
9.3 |
|
||||||
As of 2/31/2022. Source: International Energy Association, PNC
Many U.S. oil producers have remained slow to rebound from the pandemic. More than 100 energy companies filed for bankruptcy in 2020 alone, according to Bloomberg data. As a result, drilling and production activities are still 24% below pre-pandemic levels (Figure 3). Within the S&P 500® Energy sector, capital expenditures remain 30% lower than pre-pandemic levels. Despite being 3% of the index on a market capitalization basis, the Energy sector is usually one of the largest from a capital expenditure perspective.
Unlike the United States, most European countries are energy importers. On the one hand this means the probability of formal embargoes against Russia is quite low, but it also means those countries have limited options to meet energy demand from alternative sources.
Figure 3. United States Oil Production vs. Rig Count
Rig count still 24% below pre-pandemic levels
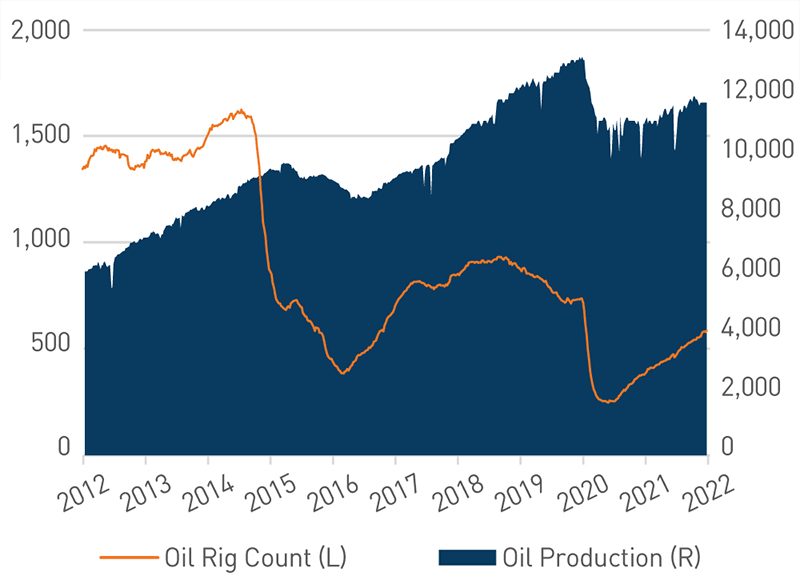
As of 3/14/2022. Source: Bloomberg, L.P.
View accessible version of this chart.
Where are Earnings at Risk?
Heading into 2022, the global earnings outlook remained positive even after an incredibly strong year in 2021. We believe there are two primary reasons current consensus estimates may be at risk:
- One of the biggest expected contributors to global earnings growth was the Energy sector, which we believe could be masking potentially weak earnings growth among other sectors.
- Should oil prices remain elevated for much of the year and impact economic activity, the business cycle could decelerate further, driving earnings revisions lower across the globe.
Through this lens, we believe valuations for developed international markets are the most at-risk from elevated oil prices. The Eurozone was already showing signs of decelerating economic activity prior to the Ukraine invasion (Figure 4). Thus, while a near-term oil price decline could be a tailwind for equity markets in the short run, it would not alter the slowing course of the business cycle, in our view.
Figure 4. Earnings, Margins and Valuations
Elevated oil prices could impact earnings revisions
Index |
Consensus 2022 Earnings Estimate |
Consensus 2022 Earnings Estimate ex-Energy |
2021 Operating Margin |
Forward P/E Decline from Pandemic Peak |
S&P 500 |
8.8% |
7.0% |
16.2% |
-5.2x |
MSCI World ex-USA |
5.7% |
3.7% |
12.7% |
-3.7x |
MSCI Emerging Markets |
6.7% |
6.9%* |
14.1% |
-4.0x |
*Energy sector earnings grew 275% in 2021, thus removing its negative growth rate from 2022 estimates strengthens EM earnings.
As of 3/14/2022. Source: FactSet®. FactSet® is a registered trademark of FactSet Research Systems, Inc. and its affiliates
Where Do We Go From Here?
As geopolitical risks add pressure to existing supply chain bottlenecks, and energy prices remain higher for an extended period, inflation is likely to remain elevated. In a rising commodity price environment, we believe there are several areas of the market where investors can seek to hedge against inflation pressures.
- Real Estate – During a rising inflation period, both public real estate investment trusts (REITs) and private real estate strategies should benefit from rising capitalization rates (the rate of return expected on a real estate investment property) and cash flow generation from potential inflation clauses.
- Small- and Mid-cap Value Equity – In addition to being overweight the Real Estate sector by an average 800 basis points relative to large-cap value, smaller capitalization value indices tend to have greater exposure to commodity producers as well. The S&P 400 MidCap Value Index and the Russell 2000 Value Index have an average 13.1% weight to Energy and Materials compared to 10.5% in the S&P 500 Value Index. We generally view the equity of commodity-producing companies as attractive when input costs are rising. In our view, these companies can benefit as their revenues tend to rise faster than their input costs.
- Emerging Markets (EM) — While many investors rush to increase direct commodity exposure during periods of rising inflation, we believe adding EM equity exposure is a good alternative. While we do not expect the return of a commodity supercycle, EM exposure to commodity-exporting countries (specifically in Latin America and the Middle East) may provide a hedge in the event of short-term bursts of inflation due to elevated commodity prices.
As we have yet to achieve a line of sight to the end of the conflict in Ukraine, the humanitarian aspect of this crisis could have long-term consequences for the world at large. The longer geopolitical risks remain, we expect elevated energy prices to persist and market volatility to remain high. While current data point to positive growth ahead, we continue to focus on our business cycle analysis to gain insight from leading indicators that may signal a change in direction.
For more information, please contact your PNC advisor.
Accessible Version of Charts
Figure 1. West Texas Intermediate Crude Spot Price ($)
(view chart) Oil prices could fall to $80 per barrel and still be in an uptrend
Date |
West Texas Intermediate Price/Barrel |
10/2/2020 |
37.05 |
12/4/2020 |
46.26 |
2/5/2021 |
56.85 |
4/2/2021 |
61.45 |
6/4/2021 |
69.62 |
8/6/2021 |
68.28 |
10/1/2021 |
75.88 |
12/3/2021 |
66.26 |
1/7/2022 |
78.9 |
3/4/2022 |
115.68 |
As of 3/16/2022 | Source: Bloomberg, L.P.
Figure 3. United States Oil Production vs. Rig Count
(view chart) Rig count still 24% below pre-pandemic levels
Date |
Rig count |
Oil production |
3/23/2012 |
1313 |
5821.00 |
3/1/2013 |
1333 |
7093.00 |
3/7/2014 |
1443 |
8182.00 |
3/6/2015 |
922 |
9366.00 |
3/4/2016 |
392 |
9078.00 |
3/3/2017 |
609 |
9088.00 |
3/2/2018 |
800 |
10369.00 |
3/1/2019 |
843 |
12100.00 |
3/6/2020 |
682 |
13000.00 |
3/5/2021 |
310 |
10900.00 |
3/11/2022 |
527 |
11600.00 |
As of 3/14/2022 | Source: Bloomberg, L.P.