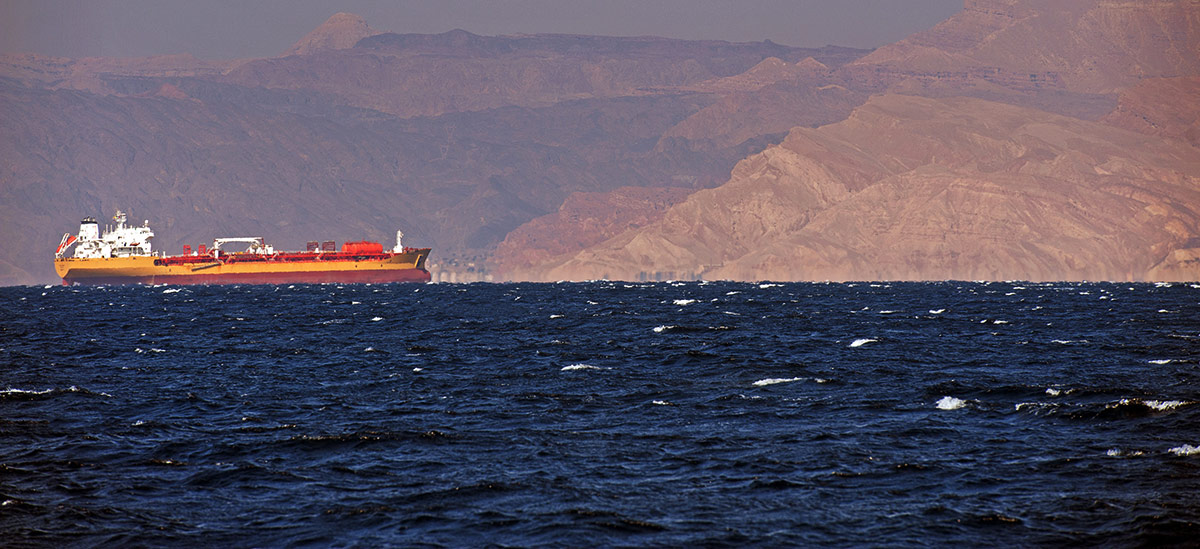
Rising conflict in the Red Sea is on investors’ radar. Concerns over the maritime trade region, located in the Middle East, have been flashing red since mid-November, as Iran-backed Houthi rebels began launching attacks on ships sailing through Bab El-Mandab Strait, a narrow and strategic choke point for shipping. At a time when it seems supply chains have mostly normalized following severe pandemic-related disruptions, some are wondering if this ongoing conflict will fan the flames of inflation by causing major goods shortages and have a material impact on the global economy. For now, we believe the situation will not result in sweeping upward pressure on inflation, but merits continued attention.
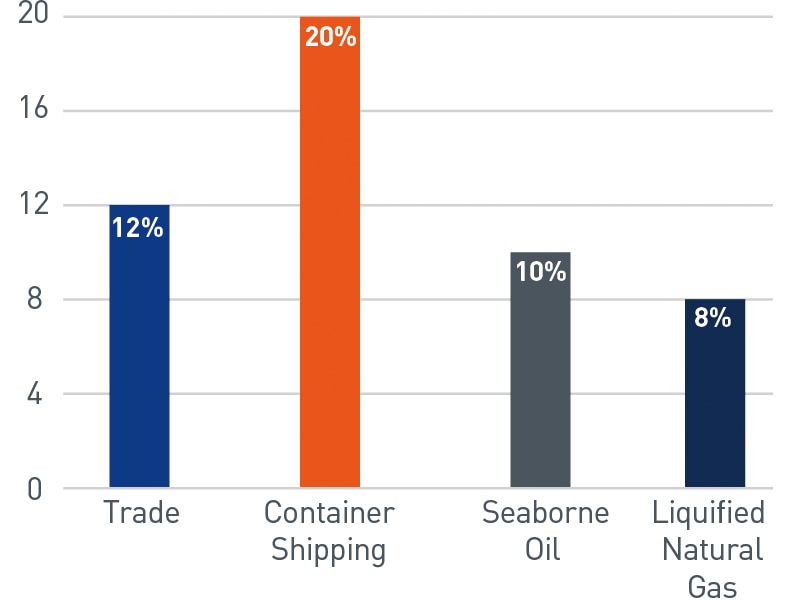
Since the initial attacks began in late 2023, there has been a material impact on container shipping in the region. Overall, the Red Sea accounts for 12% of global trade.
Figure 1. Share of Total Global Market (%)
The Red Sea is a major maritime trade route
As of 12/31/2023. Source: Bloomberg L.P.
View accessible version of this chart.
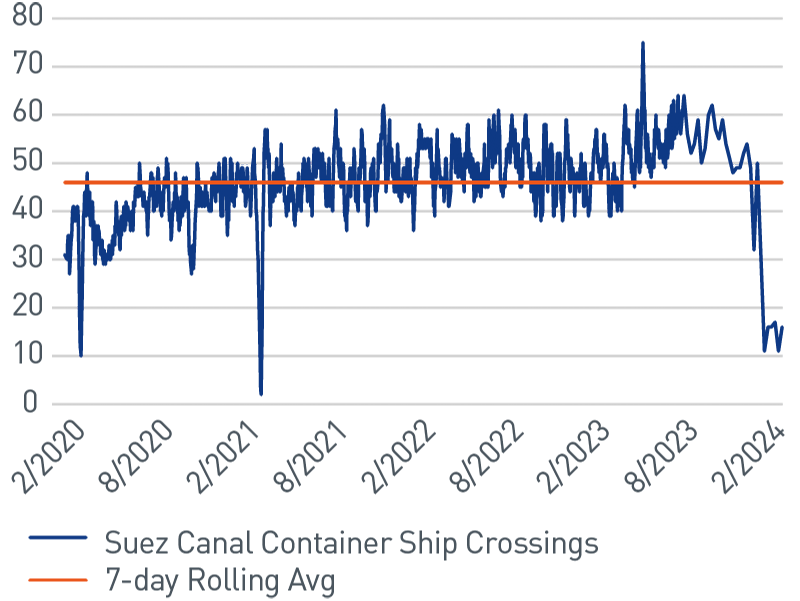
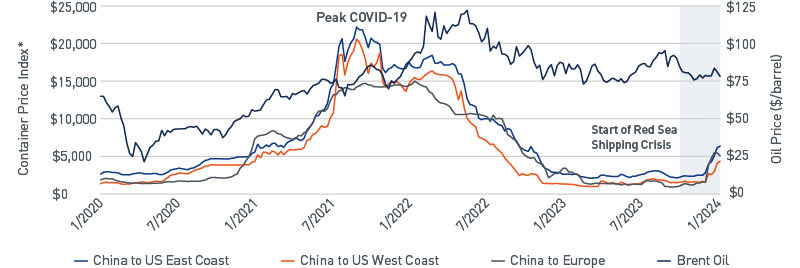
Containerized goods volume that normally sails through the Bab El-Mandab Strait, through the Suez Canal and into the Mediterranean, has fallen sharply, as container traffic has declined 85% and shipping costs have increased 200-300%.
Figure 2. Suez Canal Container Ship Traffic
The number of container vessels traveling through the Suez Canal has collapsed
As of 2/4/2024. Source: Bloomberg L.P.
View accessible version of this chart.
Container ships have been forced to go around the Cape of Good Hope in South Africa, adding 10-14 days and an estimated $250,000 of fuel surcharge per trip, according to Bloomberg data.
In contrast to container shipping, many dry bulk carriers and tankers carrying different commodities continue to operate in the region. The key difference is that as much as 60% of the crude oil tankers passing through the strait are non-Western owned and carrying oil from Russia. As Russia is Iran’s ally, these ships have been spared. This partly explains why the impact on oil prices has remained muted since the attacks began.
Oil prices remain stable, while shipping costs have increased
Further contributing to challenges for global trade are current drought restrictions in another key shipping channel, the Panama Canal. Low water levels have significantly limited the number of large ships passing through the trade route, creating incremental pressure on supply chains. This bottleneck has driven vessels from Asia that are bound for the U.S. East and Gulf Coast ports — previously rerouted from the Suez Canal — to change routes and make the longer trip around Africa.
While any constraint on global trade must be examined, especially when pandemic-era inflation is still fresh on the minds of many, we believe there are crucial nuances to this situation that are helping mitigate impacts to inflation thus far. Unlike the pandemic period, the current environment is benefiting from ample spare container fleet capacity, healthy inventory levels and strong labor markets.
Figure 4. Supply Chain Pressure Index and Container Vessel Prices
Supply chains appear healthier than during the pandemic.
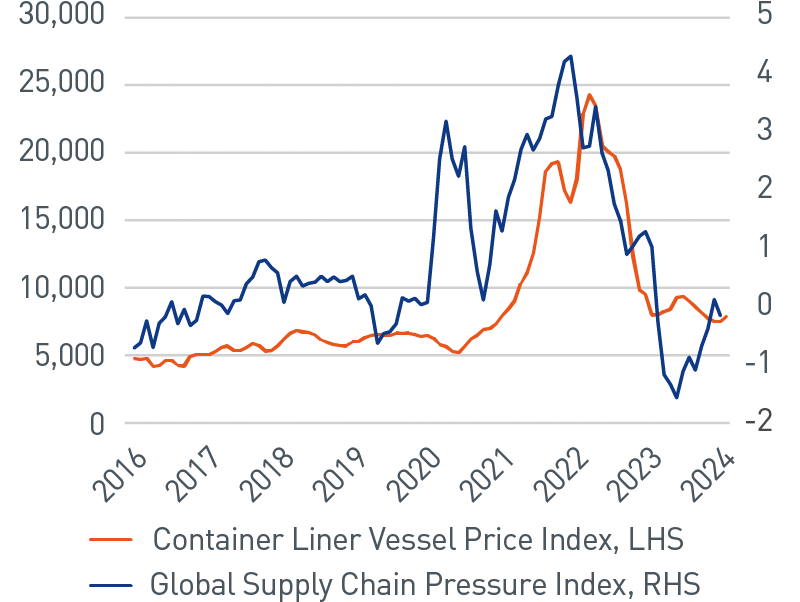
Container Vessel Price Index as of 1/31/2024. Global Supply Chain Index as of 12/2023.Source: Bloomberg L.P.
Furthermore, we do not expect a near-term, material impact to prices as transportation generally accounts for only a small portion of goods’ costs and most shipping costs are governed through long-term contracts. While the rise in shipping costs presents marginal upward pressure to prices, we believe it could get passed through to consumers without much impact. In our view, the effects will likely be felt most in industries where shortages have yet to fully normalize from the pandemic era.
Although the overall effect on shipping costs will likely be global, goods shortages could experience more regional concentration. The risk of shortages is most acute in Europe due to its geography and lack of shorter, alternative routes from Asia to the Mediterranean. For example, in the United States, the transpacific route from Asia to the West Coast is still an option, despite the potential for port congestion.
Impact on inflation contained, for now
Accessible Version of Charts
Figure 1: Share of Total Global Market (%)
The Red Sea is a major maritime trade route
Share of Global Trade |
12% |
Share of Total Container Shipping |
20% |
Share of Total Seaborne Oil |
10% |
Share of LNG |
8% |
As of 12/31/2023. Source: Bloomberg L.P.
Figure 2: Suez Canal Container Ship Traffic
The number of container vessels traveling through the Suez Canal has collapsed
Date |
Suez Canal Container Ship Crossings |
7-day Rolling Avg |
3/1/2020 |
31 |
46 |
8/1/2020 |
44 |
46 |
2/1/2021 |
43 |
46 |
8/1/2021 |
46 |
46 |
8/1/2021 |
46 |
46 |
2/1/2022 |
49 |
46 |
8/1/2022 |
49 |
46 |
2/1/2023 |
52 |
46 |
8/6/2023 |
52 |
46 |
2/4/2024 |
16 |
46 |
Oil prices remain stable, while shipping costs have increased
Date |
China to US East Coast |
China to US West Coast |
China to Europe |
Brent Oil |
2/4/2024 |
6372 |
4367 |
5097 |
78.06 |
8/6/2023 |
2667 |
1672 |
1655 |
86.81 |
2/5/2023 |
2652 |
1307 |
2920 |
86.39 |
8/7/2022 |
9885 |
6632 |
10463 |
98.15 |
2/6/2022 |
16745 |
15218 |
14728 |
94.44 |
8/1/2021 |
19620 |
18346 |
13706 |
70.7 |
2/7/2021 |
6515 |
5532 |
7939 |
62.43 |
8/2/2020 |
3232 |
2672 |
1679 |
44.4 |
2/2/2020 |
2856 |
1519 |
2051 |
54.47 |
*Based on Freightos Baltic Index, which provides 40’ container indices for ocean freight from global freight carriers, shippers and freight forwarders. As of 2/4/2024. Source: Bloomberg L.P.
Figure 4: Supply Chain Pressure Index and Container Vessel Prices
Supply chains appear healthier than during the pandemic
Date |
Global Supply Chain Pressure Index |
Container liner Vessel Price Index |
1/30/2024 |
- |
7863.61 |
2/28/2023 |
-0.27 |
8001.31 |
2/28/2022 |
2.75 |
22925.47 |
2/28/2021 |
1.9 |
8453.4 |
2/29/2020 |
1.2 |
6251.34 |
2/28/2019 |
0.14 |
6040.45 |
2/28/2018 |
0.08 |
6185.71 |
2/28/2017 |
0.18 |
5083.01 |
2/29/2016 |
-0.71 |
4772.73 |
Container Vessel Price Index as of 1/31/2024. Global Supply Chain Index as of 12/2023.Source: Bloomberg L.P.


