
With stock market corrections, yield curve inversions, negative U.S. GDP growth and the ongoing Russia-Ukraine war, macroeconomic headwinds facing investors are plentiful. Heading into 2022, we expected this year would be challenging compared to the last, but more so because we anticipated a slowdown in the business cycle, not because of a laundry list of macro factors.
During our recent meetings with clients, worries about sky-high inflation have been supplanted by concerns over the prospect of recession. Recession fears are premature, in our view, both from a business cycle and asset allocation perspective. In this market commentary, we analyze the state of the business cycle and address the differences between a decelerating expansion and a recession.
Investment Plans Change, Processes Do Not
Business cycle analysis is multifaceted and dynamic as it incorporates a range of both forward- and backward-looking data. While a large part of business cycle analysis relies on years or even decades of historical data, new information has the potential to create a paradigm shift for the market as the economic backdrop constantly evolves. Among the three components of our investment process —business cycle, valuations and technicals — we devote the most time to business cycle analysis because we believe it has such a strong influence on tactical opportunities as different phases of the cycle take hold. Each phase has recognized characteristics; however, despite a plethora of available data, there is no definitive indicator of a coming shift in the business cycle. As a result, we include a host of leading economic indicators (LEIs) in our process.
LEIs are a critical component of our business cycle framework, delivering quantitative rigor to gain insight on the market’s potential path forward. We focus on indicators such as consumer and manufacturing goods new orders, building permits and market-based factors such as the yield curve and the price level of the S&P 500®. Additionally, we use the Conference Board Leading Economic Indicators Index®, which aggregates 10 leading indicators and includes economic data and market-based components. We look at the index on a rolling six-month average basis to smooth out monthly volatility. By observing the year-over-year growth of the index, we can draw some important conclusions about the phases of the cycle:
- Recovery – Six-month rolling average growth rate is negative but accelerating
- Accelerating Expansion – Positive and accelerating
- Slowing Expansion – Positive but decelerating
- Contraction – Negative growth and decelerating
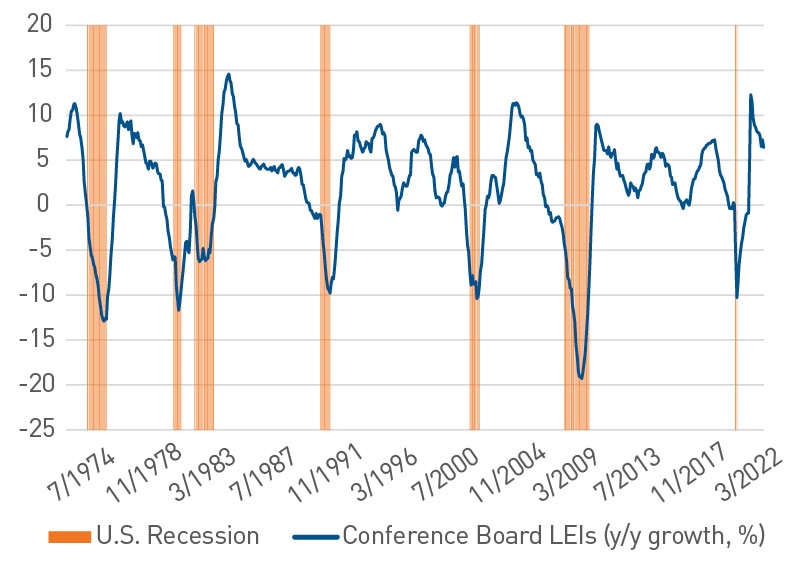
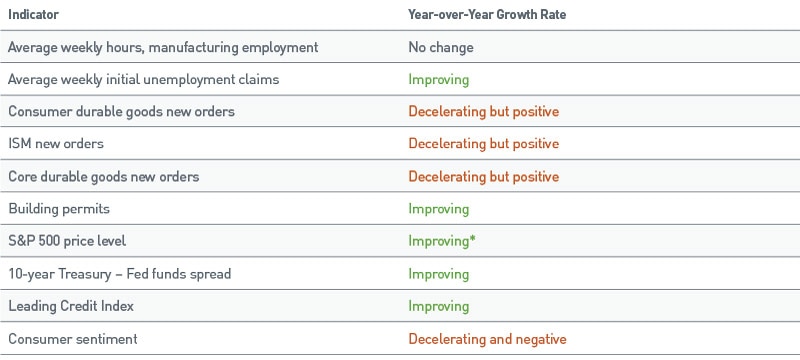
So, what are the LEIs pointing to presently? Although the growth rate of the Conference Board LEI Index has come down from its peak last year, it is still comparable to the highs of 2014 when the prior cycle still had six years to go. By observing each of the 10 indicators individually, we believe the data is indicating a slowing expansion.
Leading indicators are expected to be uneven but primarily positive in a slowing expansion
*Through March 31, the S&P 500 was up 16% over the prior 12 months, that changes to 0.2% when the calendar shifts to April.
No two cycles repeat, and while history may rhyme, markets are too dynamic to expect the exact same leadership and results every time, which is why a mosaic approach is so important to business cycle analysis.
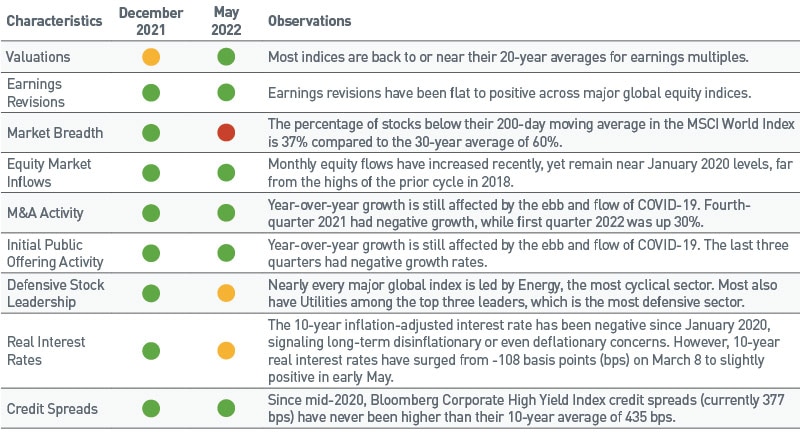
In addition to LEIs, we also look at market-based characteristics. Figure 3 is typically listed in our annual market outlook, and considering the market started the year with a pullback, we wanted to provide an update on where those metrics stand now.
Figure 3. Key Market Characteristics
Key characteristics help gauge the market’s health
Source: PNC
Where Do We Go from Here?
We maintain our view that the cycle is in a slowing expansion phase, and much of the pullback in markets is due to the sudden shift in monetary policy to address elevated inflation, not due to an imminent slowdown. Barring a negative shock to the system, our analysis indicates fundamentals remain firmly positive. When our analysis points in one direction and market prices are moving in another, we stress the importance of diversification and rebalancing exposures that have drifted away from tactical asset allocation targets. In a high-volatility regime driven by macro events, the ratio of reward versus risk to take on outsized allocations is low.
From a tactical asset allocation lens, we believe the business cycle creates opportunities when the backdrop remains highly volatile. As such, we continue to point to:
- Increasing large cap exposure: We continue to recommend moving up the market capitalization spectrum. As the business cycle slows, we believe larger companies will benefit due to their greater market share. Thus, we expect them to be better positioned as the cycle slows.
- Growth-style tilt: Growth stocks have been under considerable pressure from valuation adjustments due to rising interest rates. In our view, that is a far different concern than a shift in the cycle or a breakdown in fundamentals. We believe investors should use the current pullback as an opportunity to rebalance those positions back to tactical targets. The business cycle is still in a slowing expansion, and when growth is scarce, those companies are attractively priced in our view as valuations have compressed in recent weeks whereas the earnings outlook has not.
- U.S. over developed international: Uncertainty remains high regarding geopolitical risks and elevated energy prices in many developed international markets. The situation has worsened so quickly it will still take some time to show up in data even after the sharp decline in European consumer sentiment and muted first-quarter GDP growth in a number of EU countries.
- Alternative investments: Where appropriate, we continue to encourage building out private investment allocations across private equity (including venture capital) and private debt. Even with rising interest rates in fixed income, the Bloomberg Aggregate Bond Index is yielding just 3.5%. Private debt and real estate opportunities still offer attractive yield in the current environment in addition to higher expected total returns compared to fixed income. In addition, structured notes are another private investment option for investors looking to buffer volatility while maintaining public market exposure.
Accessible Version of Charts
Figure 1: Conference Board Leading Economic Index
Conference Board LEIs far from falling below zero
Date |
Conference Board LEIs (y/y growth, %) |
U.S. Recession |
5/31/1972 |
7.6 |
|
7/31/1974 |
-8.3 |
yes |
9/30/1976 |
9.3 |
|
11/30/1978 |
3.7 |
|
1/31/1981 |
-5 |
|
3/31/1983 |
5.1 |
|
5/31/1985 |
4.3 |
|
7/31/1987 |
4.1 |
|
9/30/1989 |
0.2 |
|
11/30/1991 |
0.2 |
|
1/31/1994 |
6.3 |
|
3/31/1996 |
0.8 |
|
5/31/1998 |
5.6 |
|
7/31/2000 |
2.8 |
|
9/30/2002 |
2.7 |
|
11/30/2004 |
9.8 |
|
1/31/2007 |
-1.7 |
|
3/31/2009 |
-19.3 |
yes |
5/31/2011 |
5.8 |
|
7/31/2013 |
2.4 |
|
9/30/2015 |
2.3 |
|
11/30/2017 |
6.1 |
|
1/31/2020 |
0.3 |
|
3/31/2022 |
6.4 |
|
As of 3/31/22. Source: Bloomberg, L.P.
Figure 2: Conference Board LEIs
Leading indicators are expected to be uneven but primarily positive in a slowing expansion
Indicator |
Year-over-Year Growth Rate |
Average weekly hours, manufacturing employment |
No change |
Average weekly initial unemployment claims |
Improving |
Consumer durable goods new orders |
Decelerating but positive |
ISM new orders |
Decelerating but positive |
Core durable goods new orders |
Decelerating but positive |
Building permits |
Improving |
S&P 500 price level |
Improving* |
10-year Treasury – Fed funds spread |
Improving |
Leading Credit Index |
Improving |
Consumer sentiment |
Decelerating and negative |
Key characteristics help gauge the market’s health
Characteristics |
December 2021 |
May 2022 |
Observations |
Valuations |
weakening |
positive |
Most indices are back to or near their 20-year averages for earnings multiples. |
Earnings Revisions |
positive |
positive |
Earnings revisions have been flat to positive across major global equity indices. |
Market Breadth |
positive |
negative |
The percentage of stocks below their 200-day moving average in the MSCI World Index is 37% compared to the 30-year average of 60%. |
Equity Market Inflows |
positive |
positive |
Monthly equity flows have increased recently, yet remain near January 2020 levels, far from the highs of the prior cycle in 2018. |
M&A Activity |
positive |
positive |
Year-over-year growth is still affected by the ebb and flow of COVID-19. Fourth-quarter 2021 had negative growth, while first quarter 2022 was up 30%. |
Initial Public Offering Activity |
positive |
positive |
Year-over-year growth is still affected by the ebb and flow of COVID-19. The last three quarters had negative growth rates. |
Defensive Stock Leadership |
positive |
weakening |
Nearly every major global index is led by Energy, the most cyclical sector. Most also have Utilities among the top three leaders, which is the most defensive sector. |
Real Interest Rates |
positive |
weakening |
The 10-year inflation-adjusted interest rate has been negative since January 2020, signaling long-term disinflationary or even deflationary concerns. However, 10-year real interest rates have surged from -108 basis points (bps) on March 8 to slightly positive in early May. |
Credit Spreads |
positive |
positive |
Since mid-2020, Bloomberg Corporate High Yield Index credit spreads (currently 377 bps) have never been higher than their 10-year average of 435 bps. |
Source: PNC